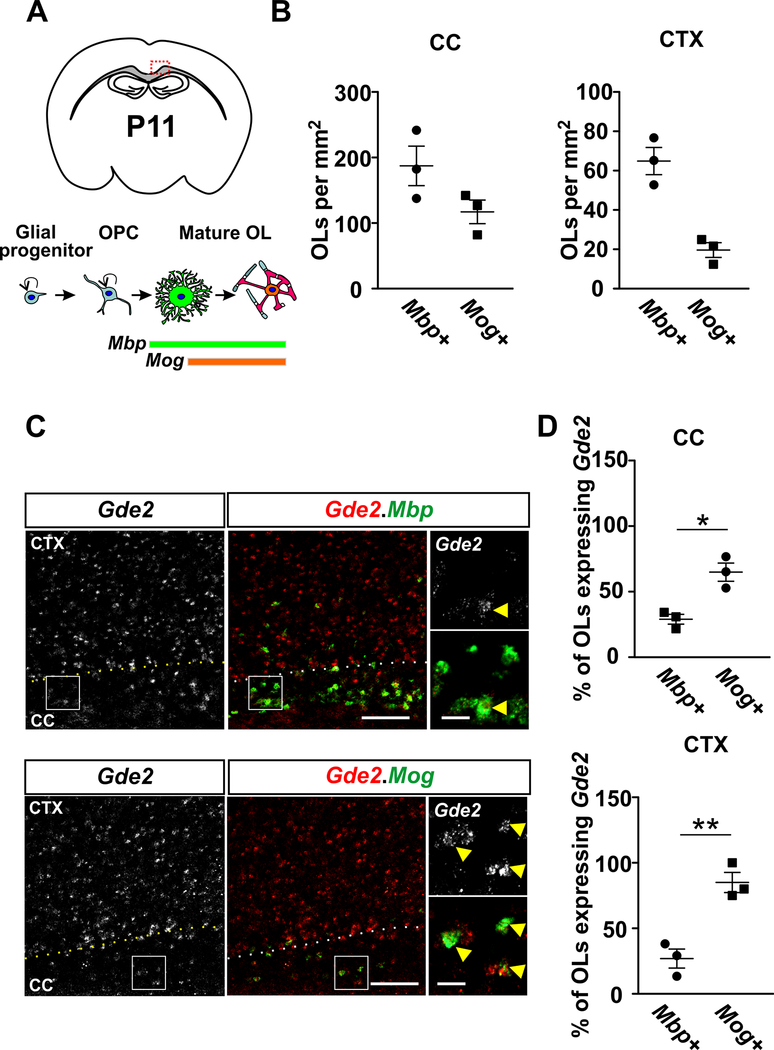
Figure 1. Gde2 is expressed in maturing OLs in postnatal brain.
(A) Top: Schematic of a coronal brain section; the red box delineates the defined region of interest (ROI) that includes the corpus callosum (CC) and adjacent motor cortex (CTX). Bottom: schematic showing gene expression profiles associated with the progression of OL development. (B) Graphs quantifying the number of Mbp+ and Mog+ OLs in the CC and CTX. (C) FISH of Gde2 mRNA and Mbp or Mog mRNAs in P11 brain tissue sections. Hatched lines mark the boundary between the CTX and the CC. Boxed areas are shown at higher magnification on the right. Arrows highlight Mbp+ or Mog+ OLs that co-express Gde2 mRNAs. (D) Graphs quantifying the percentage of Mbp+ and Mog+ OLs expressing Gde2 transcripts in CC and CTX. Higher proportions of Mog+ OLs express Gde2 transcripts compared to Mbp+ OLs in CC (*p = 0.0244) and CTX (**p = 0.0052). n = 3. Scale bar: 100 μm, inset: 20 μm.

