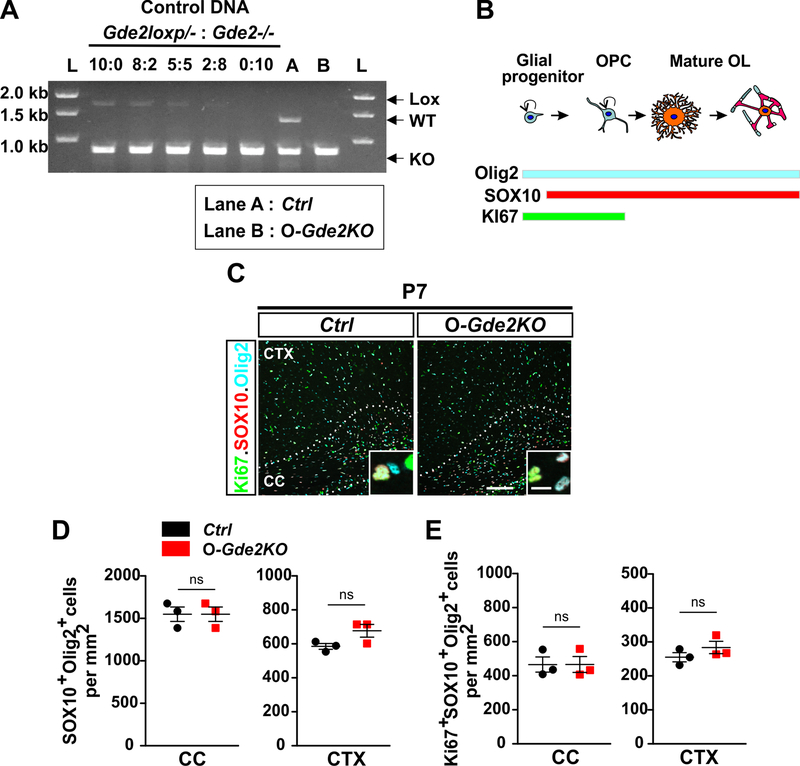
Figure 2. Loss of GDE2 in oligodendroglia does not influence OPC proliferation.
(A) Competitive PCR analysis for Gde2 from 4-HT injected Ctrl and O-Gde2KO pups. Control DNA: 5 different ratios of Gde2lox/- and Gde2−/− genomic DNAs. Gde2 PCR primers amplified DNA fragments unique to unrecombined Gde2lox (Lox, 1700bp), WT Gde2 (WT, 1300bp), and recombined Gde2lox (KO, 780bp) alleles. Ctrl (Lane A) shows presence of WT and KO fragments. O-Gde2KO (lane B) shows a similar intensity in the 1700bp fragment to the 2:8 ratio of mixed genomic DNAs. L = DNA ladder. (B) Schematic of marker proteins that distinguish proliferating OPCs. (C) Coronal section of CTX and CC Ctrl and O-Gde2KO P7 animals. Hatched lines mark the CC. Insets show magnified images of OPCs (Ki67+Sox10+Olig2+). (D) Graphs quantifying the number of oligodendroglia (Sox10+Olig2+) between Ctrl and O-Gde2KO CC (ns p =0.0857) and CTX (ns p = 0.1555). (E) Graphs quantifying the number of proliferating OPCs (Ki67+Sox10+Olig2+) between Ctrl and O-Gde2KO CC (ns p =0.5147) and CTX (ns p = 0.2971). n = 3 Ctrl (Gde2+/−; PDGFαR-CreER), 3 O-Gde2KO (Gde2lox/-; PDGFαR-CreER). Graphs: Mean ± sem, two-tailed unpaired Students t-test. Scale bar: 100 μm, inset: 10 μm.

