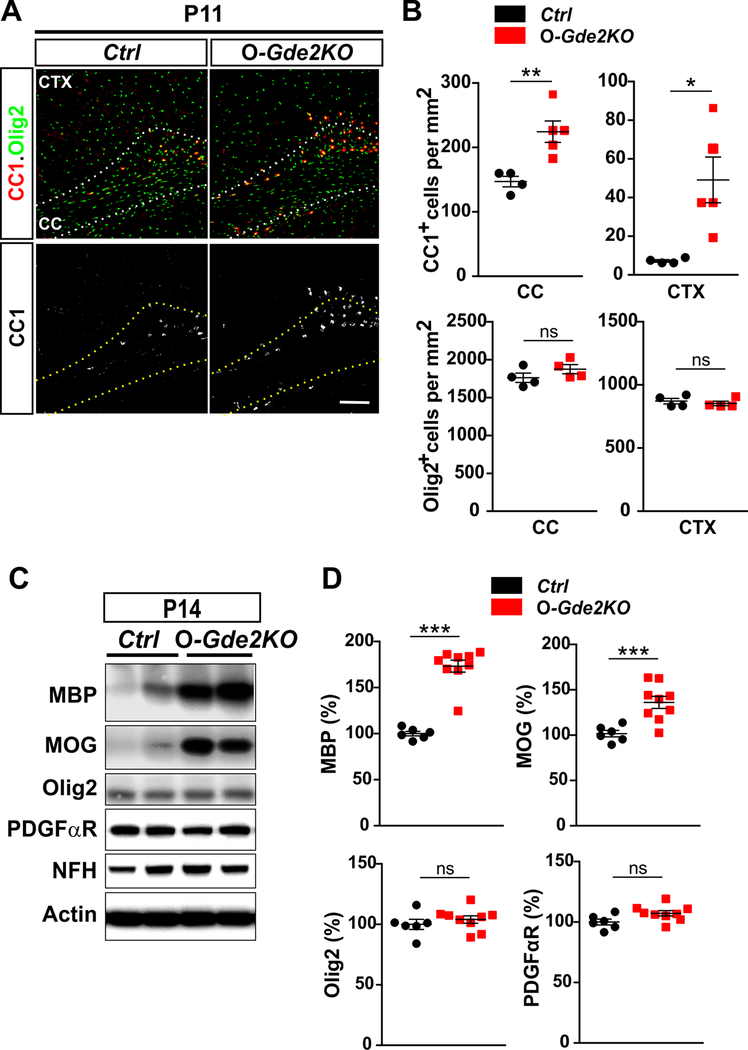
Figure 3. Oligodendroglial GDE2 prevents precocious OL maturation.
(A) Coronal sections of CTX and CC of P11 Ctrl and O-Gde2KO mice. Hatched lines delineate the CC. (B) Graphs quantifying the number of CC1+ and Olig2+ cells in CC and CTX in Ctrl and O-Gde2KO P11 littermates. CC1+ OLs are increased in O-Gde2KOs in CC (**p = 0.0087) and CTX (*p = 0.0242). Olig2+ cell numbers are equivalent between Ctrl and O-Gde2KO in CC (ns p=0.2353) and CTX (ns p=0.5548). n = 4 Ctrl, 5 O-Gde2KO. (C) Western blot of cortical extracts from P14 Ctrl and O-Gde2KO littermates. Actin is used as a loading control. NFH expression shows equivalent axonal content between the groups. (D) Graphs quantifying Western blots show increase of MBP (***p < 0.0001) and MOG (***p = 0.0007) proteins in O-Gde2KO cortical extracts compared with Ctrl. Levels of Olig2 (ns p = 0.4388) and PDGFαR (ns p = 0.0940) are unchanged between genotypes. n = 6 Ctrl, 9 O-Gde2KO. All graphs: Mean ± sem, two-tailed unpaired Students t-test. Scale bar: 100 μm.

