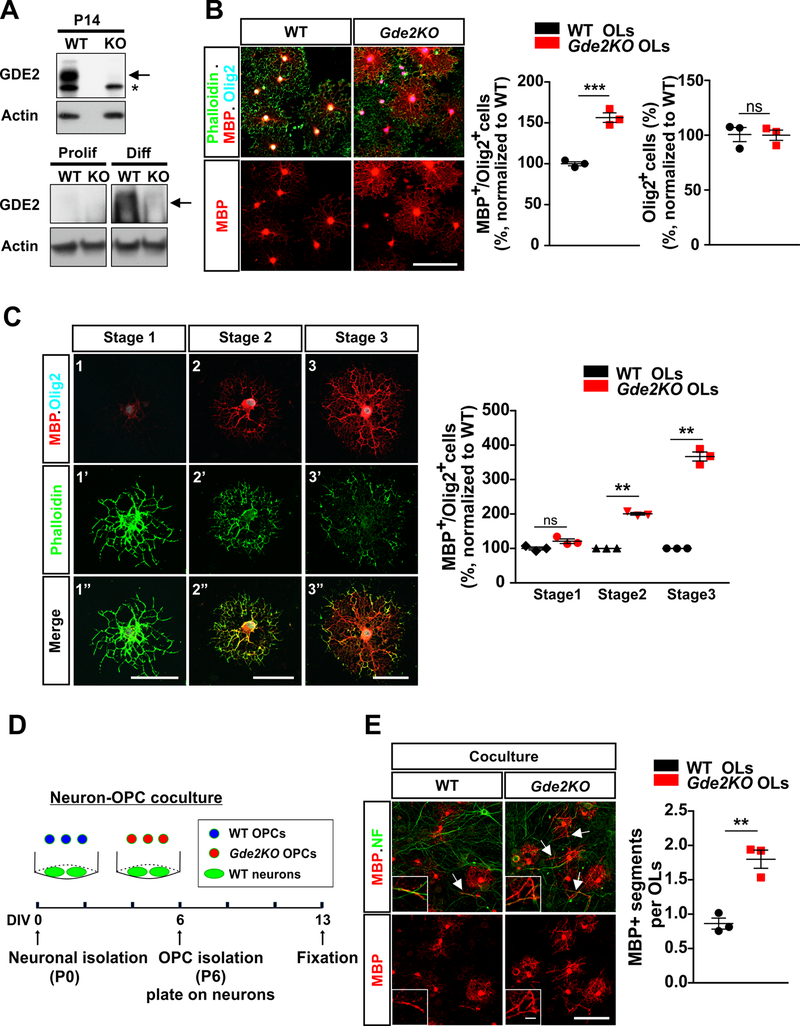
Figure 4. GDE2 regulates the tempo of OL maturation in vitro.
(A) Representative Western blot of P14 cortical lysates (Top) and extracts of proliferating OPCs and differentiated OLs (2 DIV) from WT and Gde2KOs. Arrow highlights GDE2 protein, * marks nonspecific band. (B). Representative images of WT and Gde2KO OLs. Graphs quantifying the percentage of MBP+Olig2+ OLs (***p = 0.0008) and Olig2+ cells (ns p=0.9385) normalized to WT, n = 3 WT, 3 Gde2KO. (C) Representative images of 3 stages of OL maturation in vitro. Graph quantifying the percentage of MBP+Olig2+ OLs. 2-way ANOVA ***p < 0.0001 (Bonferroni correction) ns p >0.05; **p <0.01; n = 3 WT, 3 Gde2KO. (D) Schematic of neuron-OPC co-culture. (E) Representative images of WT and Gde2KO OPCs co-cultured with WT neurons. Insets show higher magnification of myelinated axons. Arrows highlight myelinated axons. Graph quantifying the numbers of MBP+ segments (normalized to WT OLs) **p = 0.0037, n = 3 WT, 3 Gde2KO. All graphs: Mean ± sem. (B, E) two-tailed unpaired Students t-test; Scale bars: (B, E) 100 μm, inset: 10 μm (C) 50 μm.

