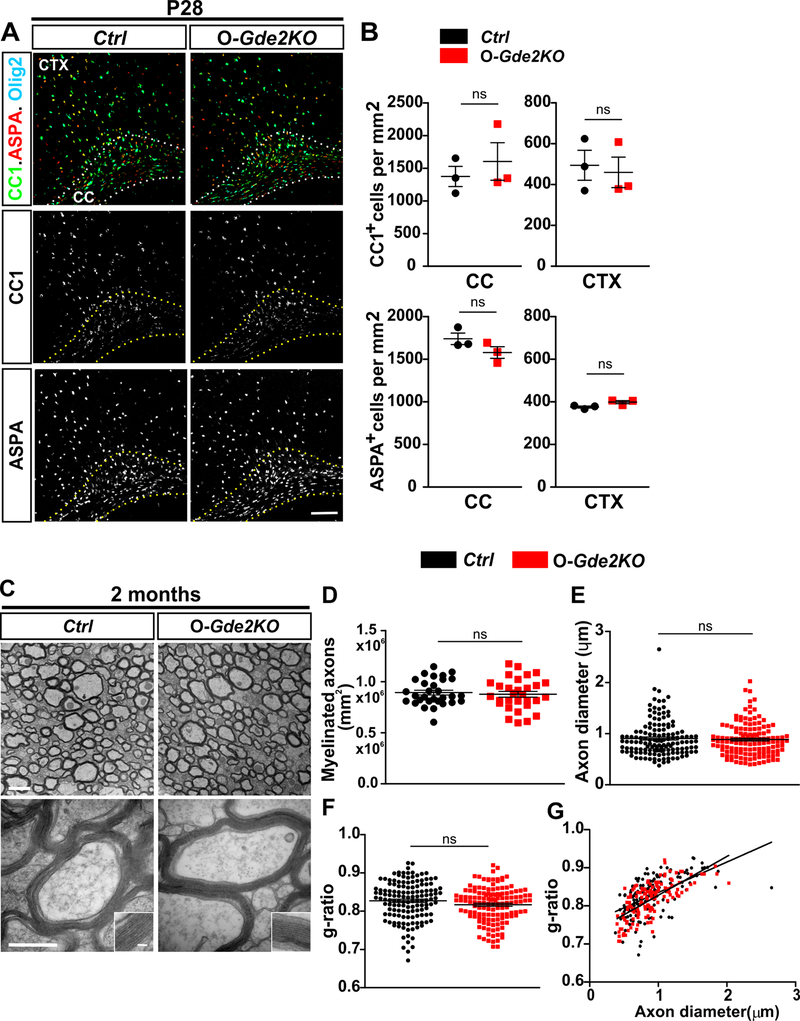
Figure 6. O-Gde2KO OL maturation and myelination deficits are restored in the adult.
(A) Coronal sections of mouse CTX and CC from Ctrl and O-Gde2KO P28 animals. Hatched lines delineate the CC. (B) Graphs quantifying the number of mature OLs (CC1+ and ASPA+) show no difference in CC1+ OLs between Ctrl and O-Gde2KO CC (ns = 0.5217) and CTX (ns = 0.7564) and no change in ASPA+ OLs in CC (ns =0.1922) and CTX (ns = 0.0721) at P28. n = 3 Ctrl, 3 O-Gde2KO. (C) TEM of the CC of 2-month Ctrl and O-Gde2KO animals. Insets show higher magnification of the myelin sheath. (D-G) Graphs show comparable numbers of myelinated axons (D, ns P=0.6555; points refer to individual ROI from 3 Ctrl and 3 O-Gde2KOs), g-ratios (F, G, ns p =0.0728; points refer to individual myelinated axons; 3 Ctrl and 3 O-Gde2KOs), and axon diameters (E, ns p = 0.6076; points refer to individual axons, 3 Ctrl and 3 O-Gde2KOs) between genotypes. All graphs: Mean ± sem, two-tailed unpaired Students t-test. Scale bars: (A) 100 μm (C) 1 μm (top), 500 nm (bottom), inset 50 nm.

