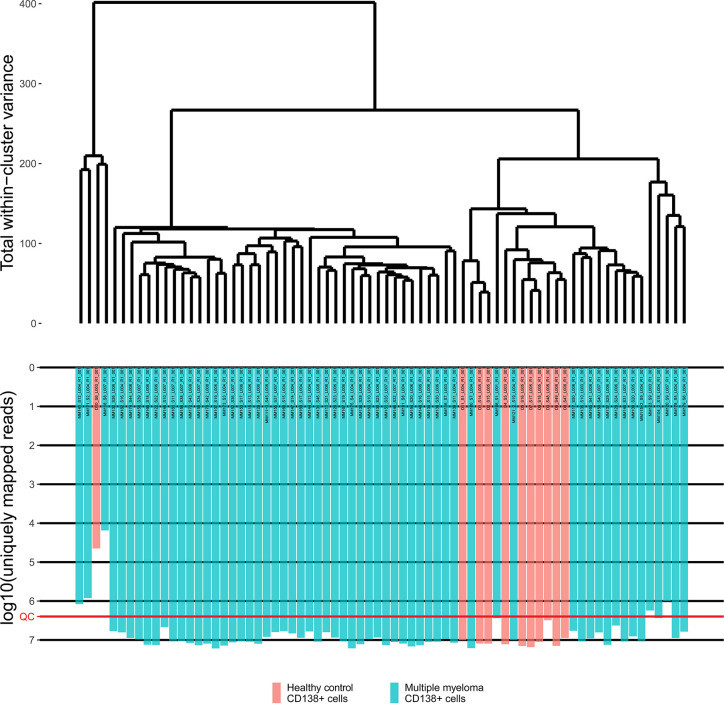
Figure 1.
The hierarchical clustering dendrogram of all experimental RNA sequencing profiles of the control and multiple myeloma samples. Gene expression data were used to calculate Euclidian distances between the samples. Color indicates the sample type. The lower scale indicates the number of uniquely mapped reads. QC denotes the quality control threshold of 2.5 million uniquely mapped reads.

