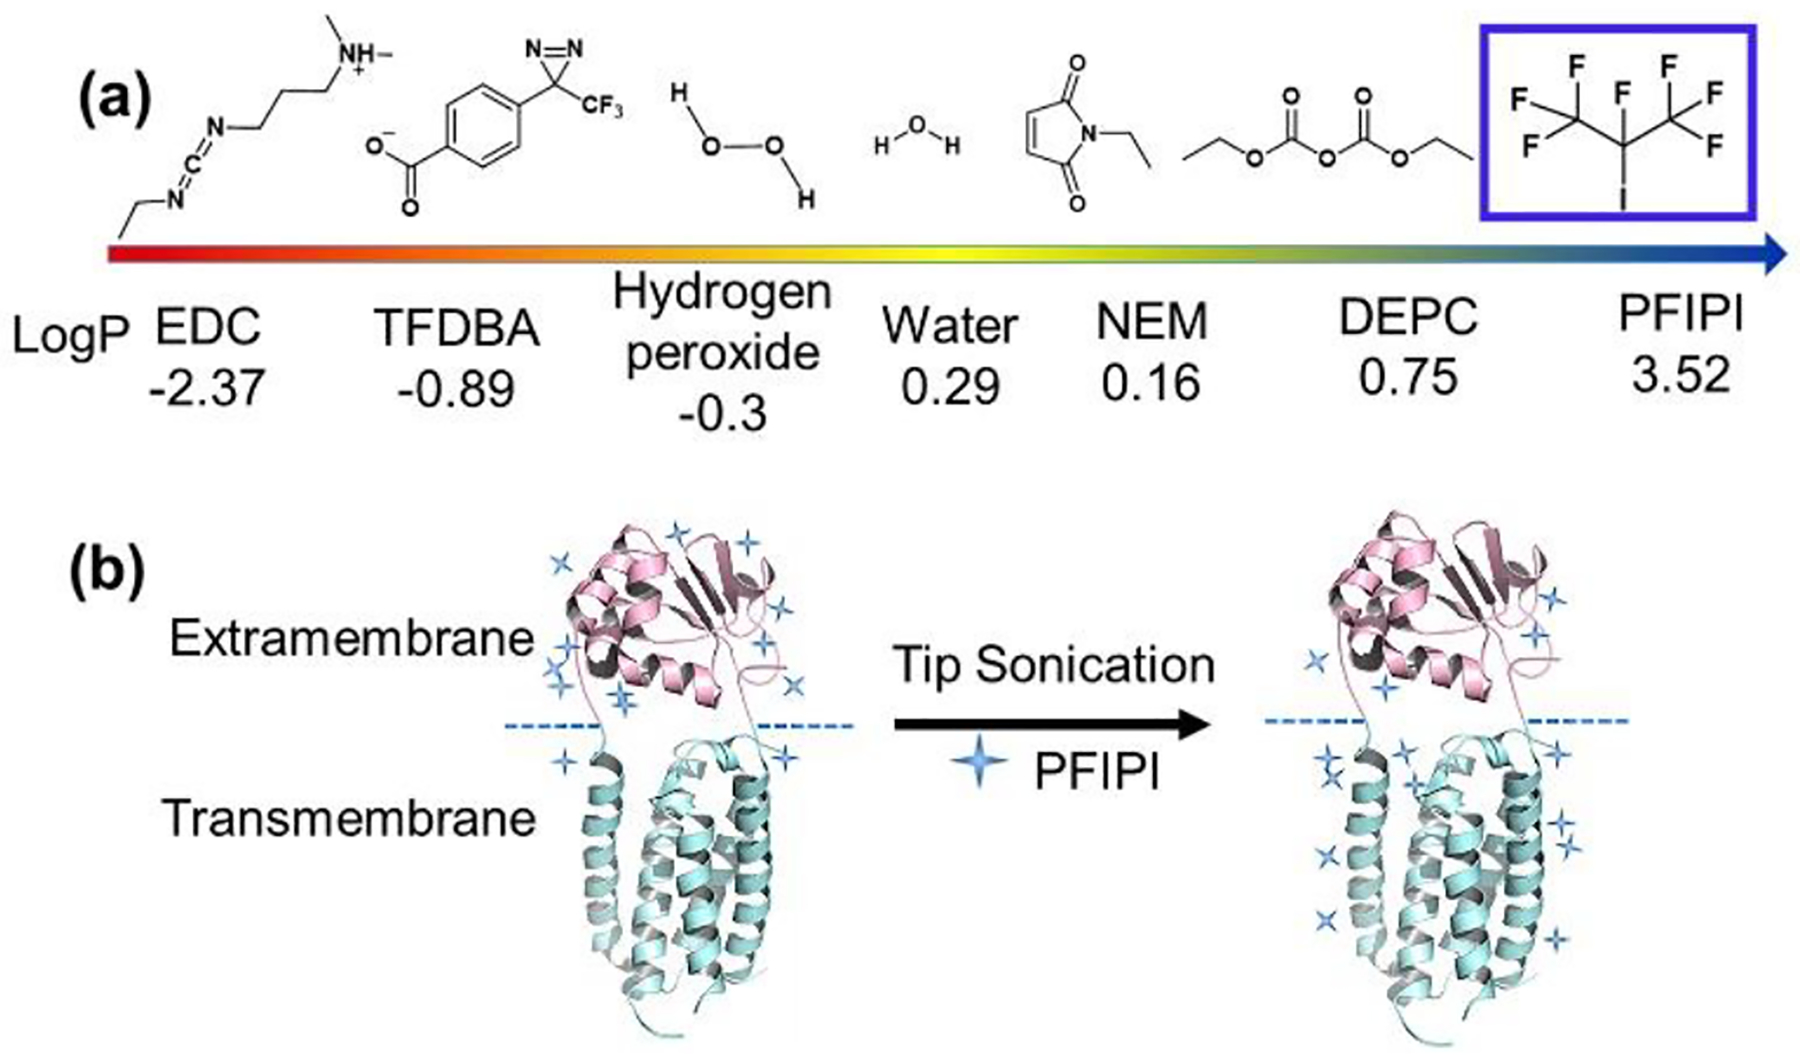
Figure 1.

(a) Analysis of reagents and their logP values for utility in protein transmembrane footprinting. LogP values were simulated using the web-based interactive software from Molinspiration Cheminformatics. (b) Enhanced partition of PFIPI into a micelle with tip sonication showing improved yields of transmembrane footprinting (blue +). The region in magenta is the water-accessible extramembrane domain, whereas the region in cyan is hydrophobic transmembrane. The blue dashed line is the boundary dividing the two domains
