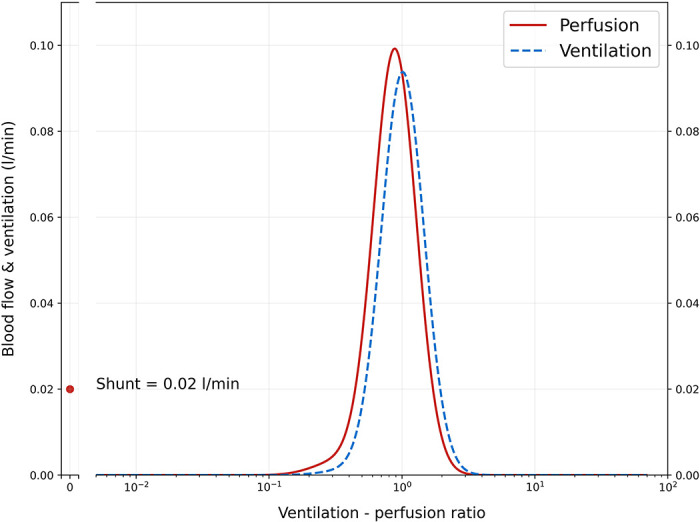
Figure 3.

Graphical representation of the ventilation–perfusion (VA/Q) distribution of the solution with the shortest Euclidean distance from the target (PaO2 = 90 mmHg, PaCO2 = 40 mmHg). On the x-axis a log-space of 500 VA/Q compartments (498 + shunt and dead space) is represented, whereas on the y-axis, the relative amount of blood flow and alveolar ventilation for each compartment is shown. The parameters used to recover this distribution were: QT = 5 L/min, FiO2 = 0.21, shunt = 0.5%, hemoglobin = 14 g/dL, BE = 0 mEq/L, PvO2 = 40 mmHg, PvCO2 = 45 mmHg. Despite the assumption of a bimodal distribution, Qmean1 and Qmean2 were close enough on a logarithmic scale that the resulting distribution was practically unimodal, as expected from a healthy subject. Of note, the shunt compartment is visually larger than the traditional MIGET data acquired on healthy subjects. This is due to the use of 500 compartments instead of the traditional 50: through each one of them flows a comparatively smaller blood flow, resulting in a visually smaller scale on the y-axis.
