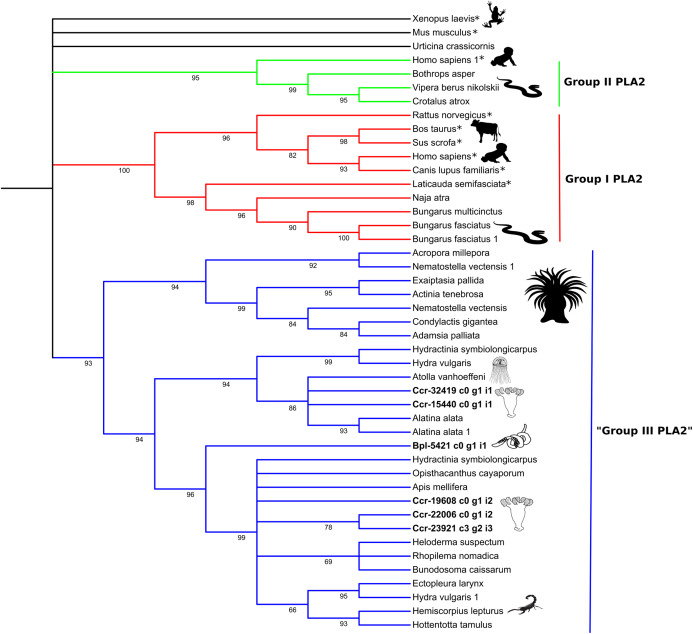
Figure 5. Phylogenetic tree of the Phospholipase A2 gene family.
Numbers below nodes show bootstrap support values from 1,000 replicates. Nodes that received ≤60% bootstrap support were collapsed. ML Phylogram was generated from amino-acid alignments of Kunitz-type homologs using WAG+I+G model. Abbreviations: An asterix (*) indicates non-toxin sequences, Bpl = Buddenbrockia plumatellae Ccr = Calvadosia cruxmelitensis; Myx = Myxosporea; Phy = Polypodium hydriforme.

