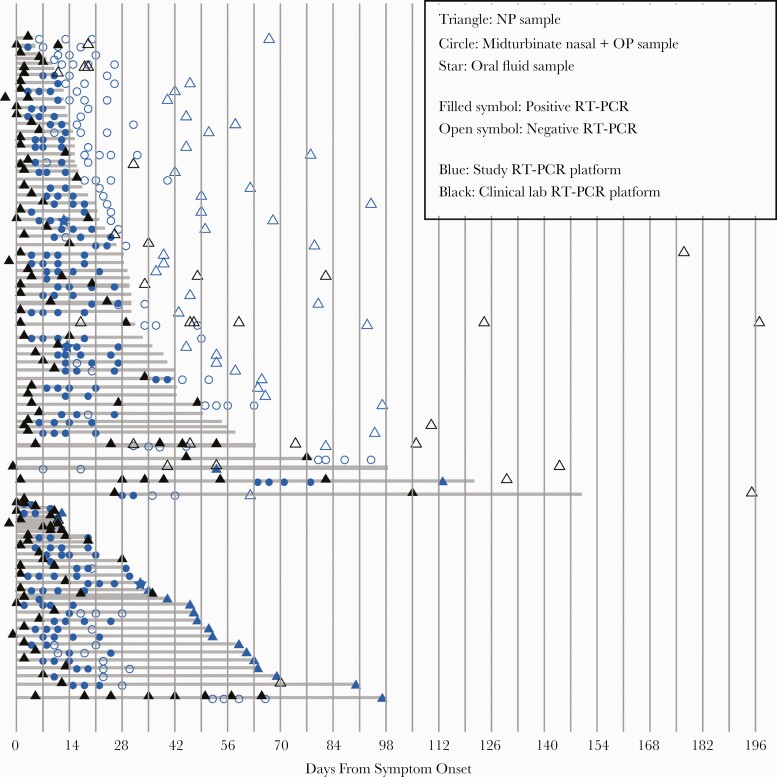
Figure 2.
Longitudinal SARS-CoV-2 RT-PCR sampling in outpatients. SARS-CoV-2 RT-PCR test results by day from symptom onset. Each row represents 1 participant. Shown here are nasal samples. Stars indicate a sample time point at which the nasal sample was negative and the oral fluid sample was positive. Included in the top grouping are participants whose last RT-PCR test was negative, and in the bottom group are those whose last RT-PCR test was positive. Shaded gray lines indicate the number of days from symptom onset until the midpoint between the last positive sample and the next negative sample (top grouping) or until the last positive sample (bottom grouping). Nasopharyngeal (NP) swabs collected by a health care worker are indicated by triangles; self-collected midturbinate nasal-oropharyngeal (OP) swab combined in viral transport media are indicated by circles. Abbreviations: RT-PCR, reverse transcription polymerase chain reaction; SARS-CoV-2, severe acute respiratory syndrome coronavirus 2.

