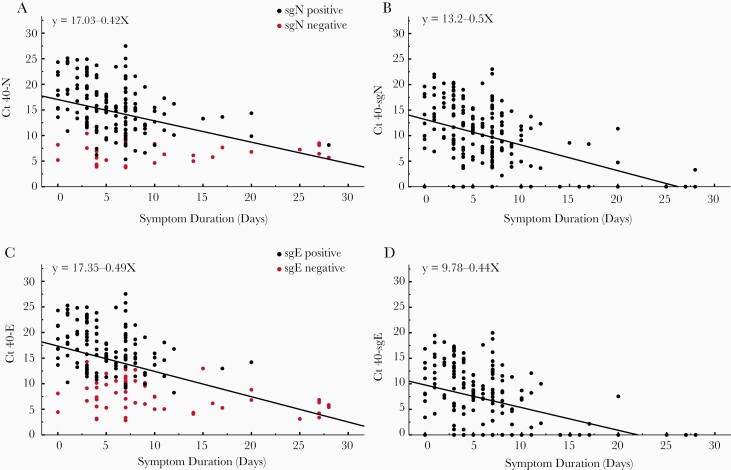
Figure 1.
Comparison of cycle threshold (Ct) vs day from symptom onset for clinical samples obtained from 185 inpatients. Vertical axis represents 40 minus the Ct. Total N (A), subgenomic N (sgN; B), total E (C), and subgenomic E (sgE; D). Red dots in A and C represent subgenomic-negative samples and black dots represent subgenomic-positive samples. Of the 185 patients, 57 were negative for sgE and 28 were negative for sgN (shown on y-axis). Pearson correlation coefficients: N: –0.420, P < .0001; sgN: –0.457, P < .0001; E: –0.468, P < .0001; sgE: –0.416, P < .0001. Linear regression equations are indicated in each panel.

