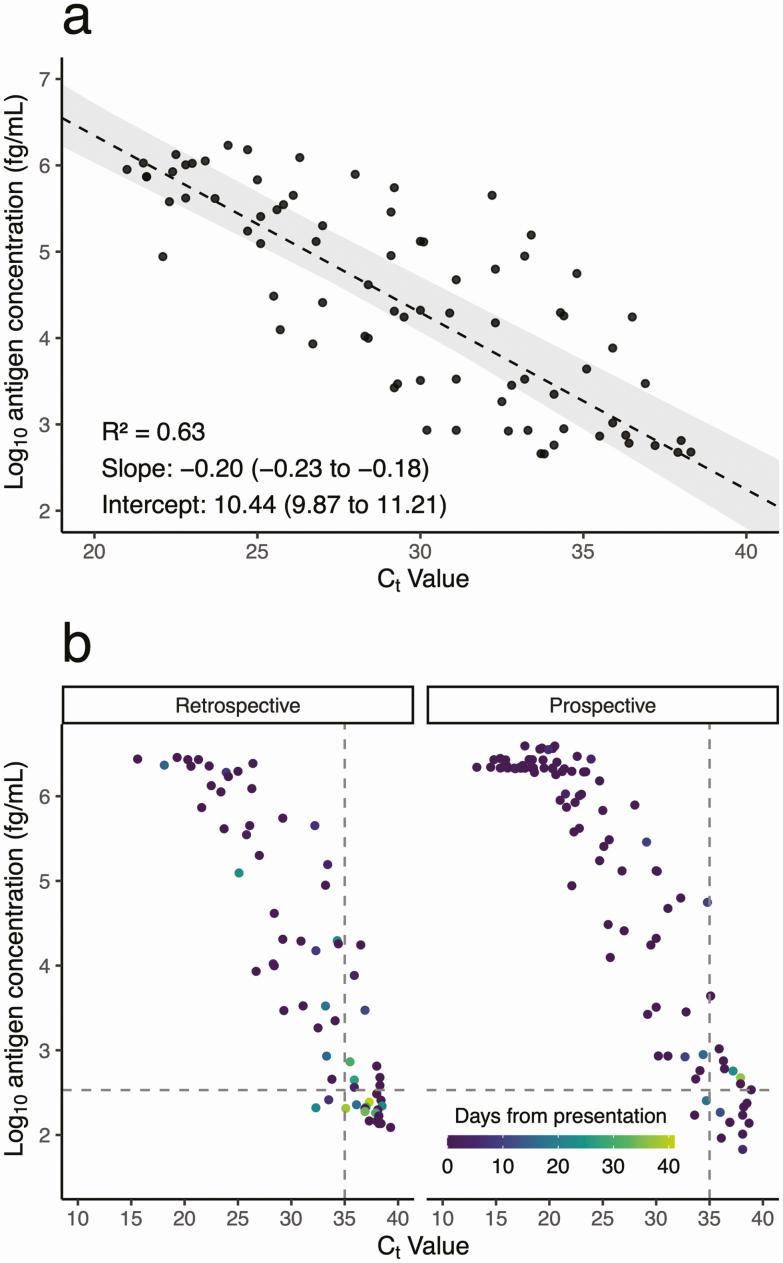
Figure 1.
Relationship between log10 antigen concentration (fg/mL) versus cycle threshold (Ct) value in (A) RNA-positive, antigen-positive samples with antigen levels in the linear range (n = 79), and (B) all RNA-positive samples with available clinical data (n = 167). (A) Passing-Bablok regression (dashed line) of antigen versus RNA levels, with shaded area representing the bootstrap 95% confidence interval. (B) Subset by cohort (retrospective on left and prospective on right), and colored by number of days between initial presentation and specimen collection. The horizontal dashed line represents the limit of detection threshold, above which samples were called positive for antigen. The vertical dashed line represents a Ct of 35.

