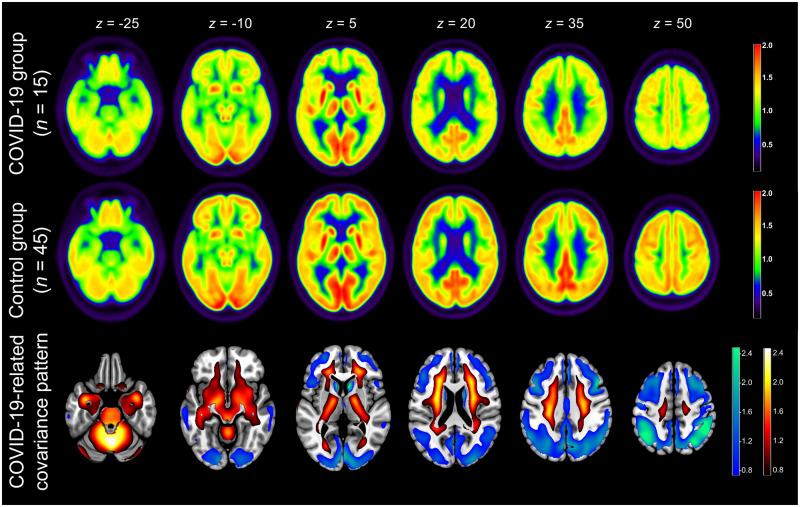
Figure 3.
Result of 18FDG PET group analysis. Top and middle row: Transaxial sections of group averaged, spatially normalized 18FDG PET scans in COVID-19 patients and controls. Given the apparent involvement of grey matter on individual visual reads, all scans were normalized to white matter (SPM white matter mask, white matter probability > 50%). Bottom row: COVID-19-related spatial covariance pattern of cerebral glucose metabolism constructed by PCA of the aforementioned groups. For illustration purposes, the spatial covariance pattern was restricted to voxels of the highest quartile of covariance of voxel weights (positive and negative; note that all brain voxels contribute to the pattern expression score according to their weights) and overlaid onto an MRI template. Voxels with negative region weights are colour-coded in cool colours, and regions with positive region weights in hot colours [neurological orientation, i.e. left image side corresponds to patient’s left body side; numbers denote the axial (z) position in millimetres].

