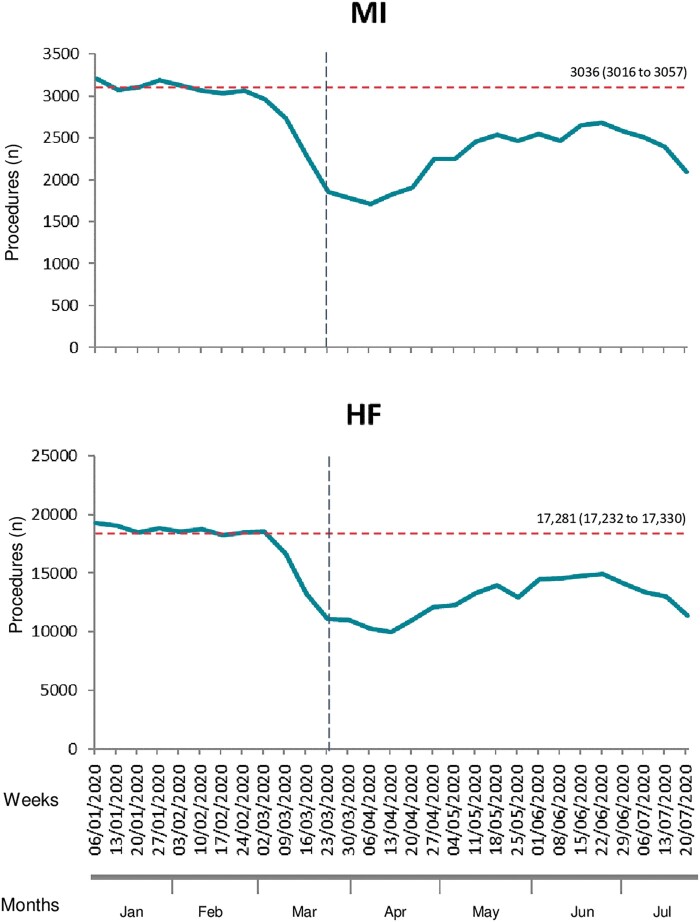
Figure 4.
Hospitalizations for myocardial infarction and heart failure in England during the COVID-19 pandemic. Graphs show weekly numbers of hospitalizations. Dashed horizontal lines indicate the mean weekly number of hospitalizations during the reference period in 2019. Mean (95% CI) are shown above the lines. The black, vertical, dashed line marks the announcement of the national ‘lockdown’, on 23 March 2020. Changes in weekly rates in relation corresponding weeks during the reference period in 2019 were all statistically significant (P < 0.001).

