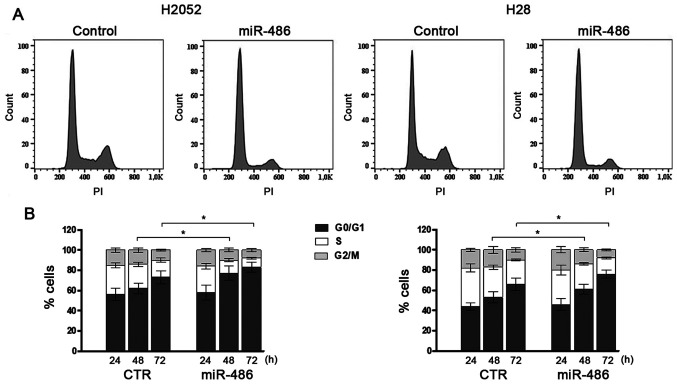
Figure 2.
miR-486 mimic transfection slows cell cycle progression. (A) Flow cytometry histograms of the H2052 and H28 cell cycle following 72 h of transfection. By monoparametric DNA analysis three distinct phases could be recognized: The G0/G1, S and G2M phase. (B) Cell cycle distribution in transfected H2052 and H28 cells (up to 72 h). Statistical significance is indicated vs. the control: *P<0.05.

