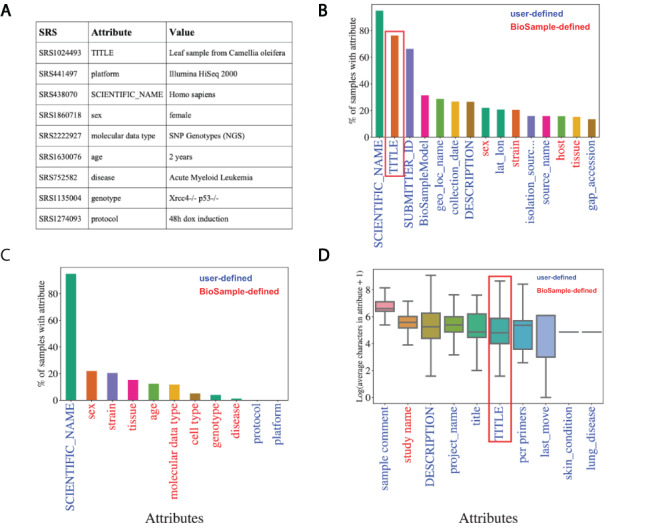
Figure 2.

Missing metadata in SRA. (A) Examples of SRA attribute-value pairs. Percentage of all samples that contained annotations for the (B) top 15 most used attributes and (C) the 11 selected attributes. X-axis shows attribute type and y-axis shows the percentage of total samples that used the given attribute. (D) Distributions of the average number of characters for the 10 longest (by mean) attributes in BioSample annotations of SRA. X-axis shows attribute type and y-axis shows the Log2(average characters) for a given attribute. Blue labels indicate a user defined attribute, red labels indicate a BioSample defined attribute. TITLE attribute in panels (B) and (D) is highlighted.
