
Figure 4.
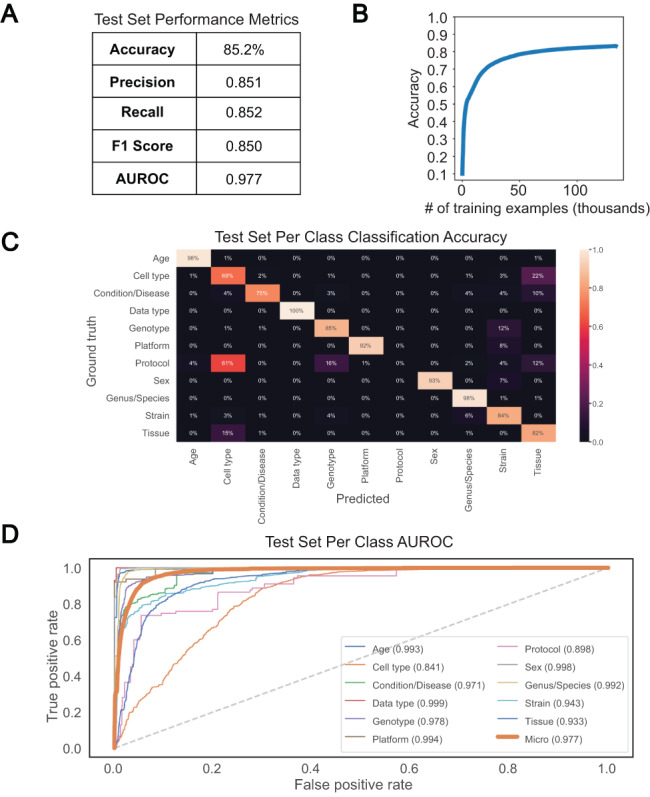
Performance of bi-LSTM in metadata category classification. (A) Accuracy, precision, recall, F1 score, and average AUROC calculated for all categories combined on held-out test set. (B) Accuracy of model classification on training set (y-axis) plotted against the number of training examples input (in thousands). (C) Percentage of each category correctly classified on held-out test set, shown as a heatmap, with predicted values on the x-axis and ground truth labels on the y-axis. (D) Receiver operating characteristic (ROC) curves for each category along with the average over all test set examples (micro average).