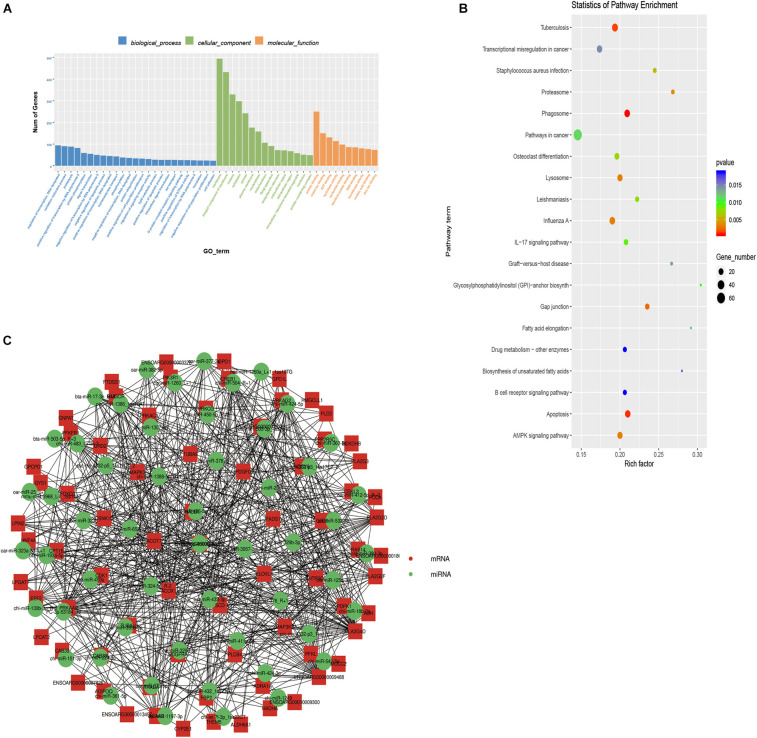
FIGURE 2.
Function enrichment analysis of target genes. (A) The top 25 GO terms of biological processes, top 15 GO terms of cellular components, top 10 GO terms of molecular functions of target genes. (B) Top 20 KEGG pathways on targets of differentially expressed miRNAs. (C) Co-expression network for differentially expressed miRNAs and their targets. The red points represent critical mRNAs involved in lipid deposition. The green points represent candidate miRNAs, which can regulate target genes.

