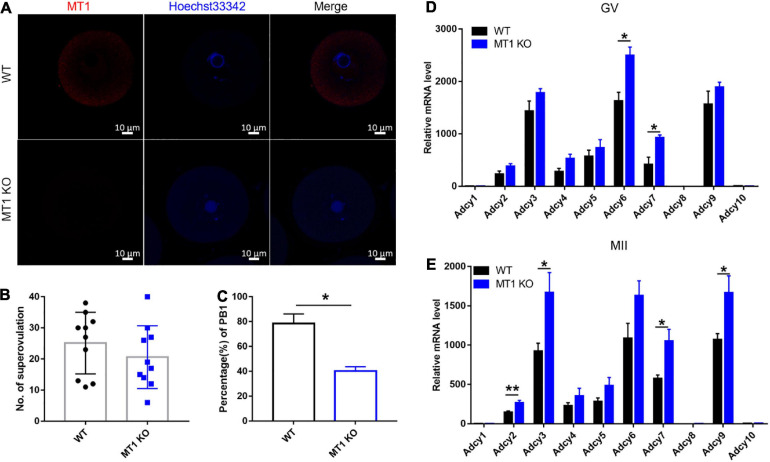
FIGURE 4.
Effects of MT1 KO on mouse oocyte maturation and cAMP synthesis ability of the ovary. (A) Images of immunofluorescence of MT1 at the GV stage in WT and MT1 KO oocytes. Bar = 10 μm. (B,C) The number of superovulated oocytes and the rate of PB1 in WT and MT1 KO oocytes. No. of superovulation: n = 7; PB1: n = 4. (D,E) The mRNA level of cAMP synthases in the ovaries of WT and MT1 KO mice detected by qPCR. Data represent the mean with SEM. (*P < 0.05, **P < 0.01) vs its respective group, determined by one-way ANOVA followed by Tukey post hoc comparisons (n = 5).

