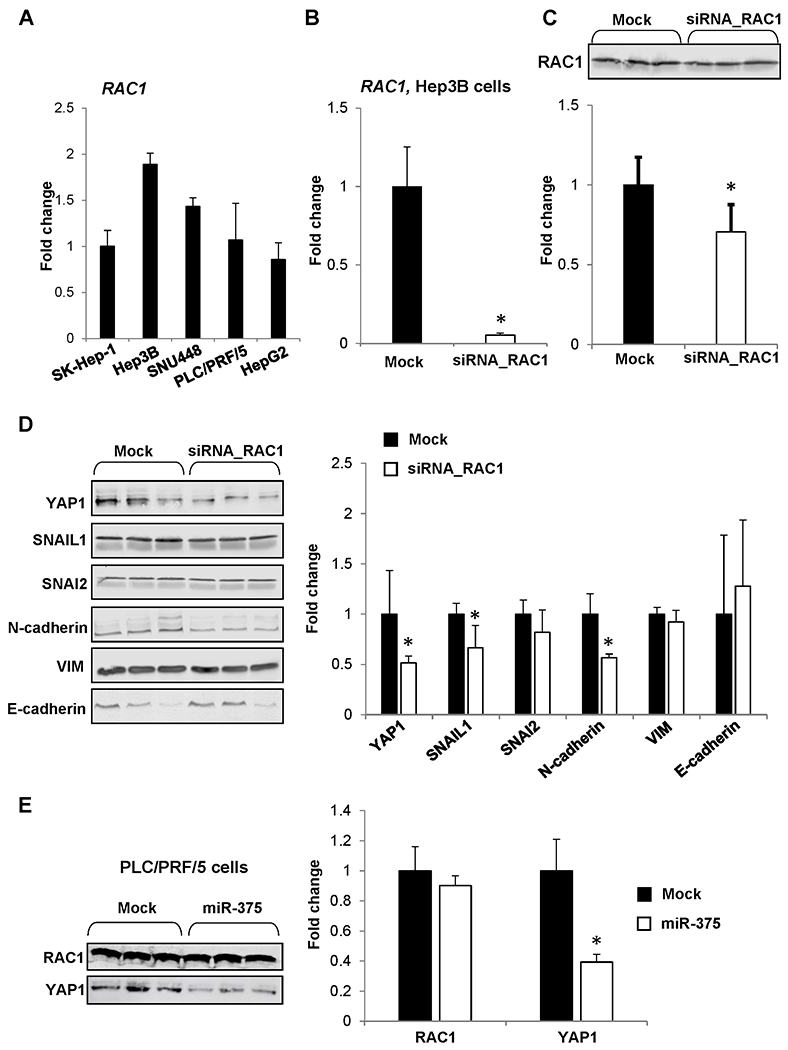
Figure 5. In vitro analysis of RAC1 down-regulation in human HCC cells.

(A) RAC1 expression in SK-Hep-1, Hep3B, SNU448, PLC/PRF/5, and HepG2 human liver cancer lines. (B) Level of RAC1 mRNA and (C) RAC1 protein in Hep3B cells transfected with RAC1 siRNA. Values are mean ± SD, n = 3. Asterisks (*) denote a statistically significant difference between groups. (D) Level of YAP1, SNAIL1, SNAI2, N-cadherin, VIM, and E-cadherin proteins in Hep3B human liver cancer cells transfected with RAC1 siRNA. Values are mean ± SD, n = 3. Asterisks (*) denote a statistically significant difference between groups. (E) Level of RAC1 and YAP1 proteins in PLC/PRF5 human liver cancer cells after transfection of microRNA miR-375. The results are presented as an average fold change in the level of each protein in miR-375-transfected PLC/PRF/5 cells relative to that in the mock group, which were assigned a value 1. Values are mean ± SD, n = 3. Asterisks (*) denote a statistically significant difference between groups.
