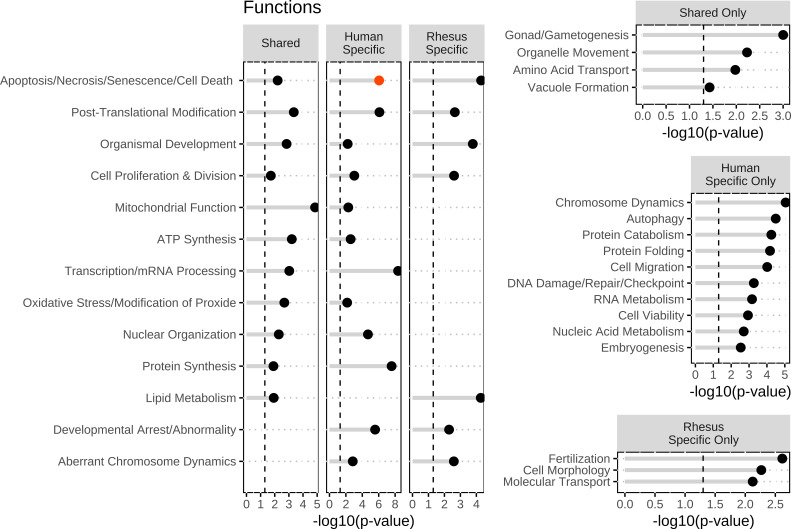
Figure 3.
Top biological functions identified within all three groups (shared, human specific, and rhesus specific), in at least two groups, human-specific only, rhesus-specific, and shared-specific DEGs groups. Biological functions were identified in ingenuity pathway analysis and then were graphed in R. Significance was set at a −log10(P value) of 1.3 or greater as indicated by the vertical dashed lines and all entries were found to be significant. The red dots indicate activation of the functions with a z > 1.96. The dots indicate inhibition of the functions with a z < −1.96. The black dots indicate no significant z-score to determine directionally of the functions. DEGs, differentially expressed genes.

