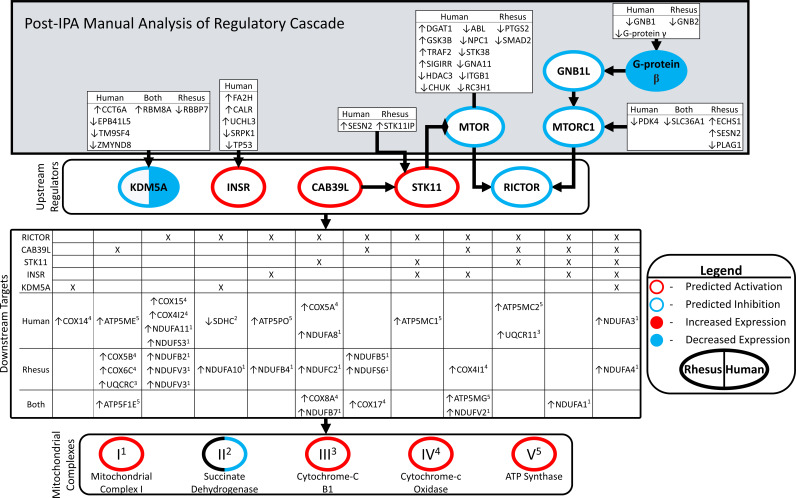
Figure 4.
Linking upstream regulators and oxidative phosphorylation. Network diagram connecting upstream regulators, their upstream effectors, downstream targets in oxidative phosphorylation, and membership in mitochondrial complexes. Figure consists of four hierarchical blocked areas. “Upstream regulators” (KDM5A, INSR, CAB39L, and RICTOR) were significant in both human and rhesus, with significant z-scores. The overlap of their downstream targets, and the membership in either human/rhesus DEG lists “downstream targets.” Superscripts adjacent to DEG targets denote membership in mitochondrial complexes 1–4. “Post-IPA Manual Analysis of Regulatory Cascade”: IPA queried for molecules upstream of “upstream regulators” present in human/rhesus DEG lists. Border colors denote predicted significant z-scores: red = activated in FTM compared with MII, blue = inhibited, black = not significant z-score. Filled colors denote significant changes in expression from DEG analysis: red = upregulated in FTM compared with MII, blue = downregulated. Coloring on left relates to rhesus, right to human. Arrows preceding gene symbols denote direction of change in FTM compared with MII. DEGs, differentially expressed genes; FTM, failed-to-mature; MII, metaphase II; IPA, ingenuity pathway analysis.

