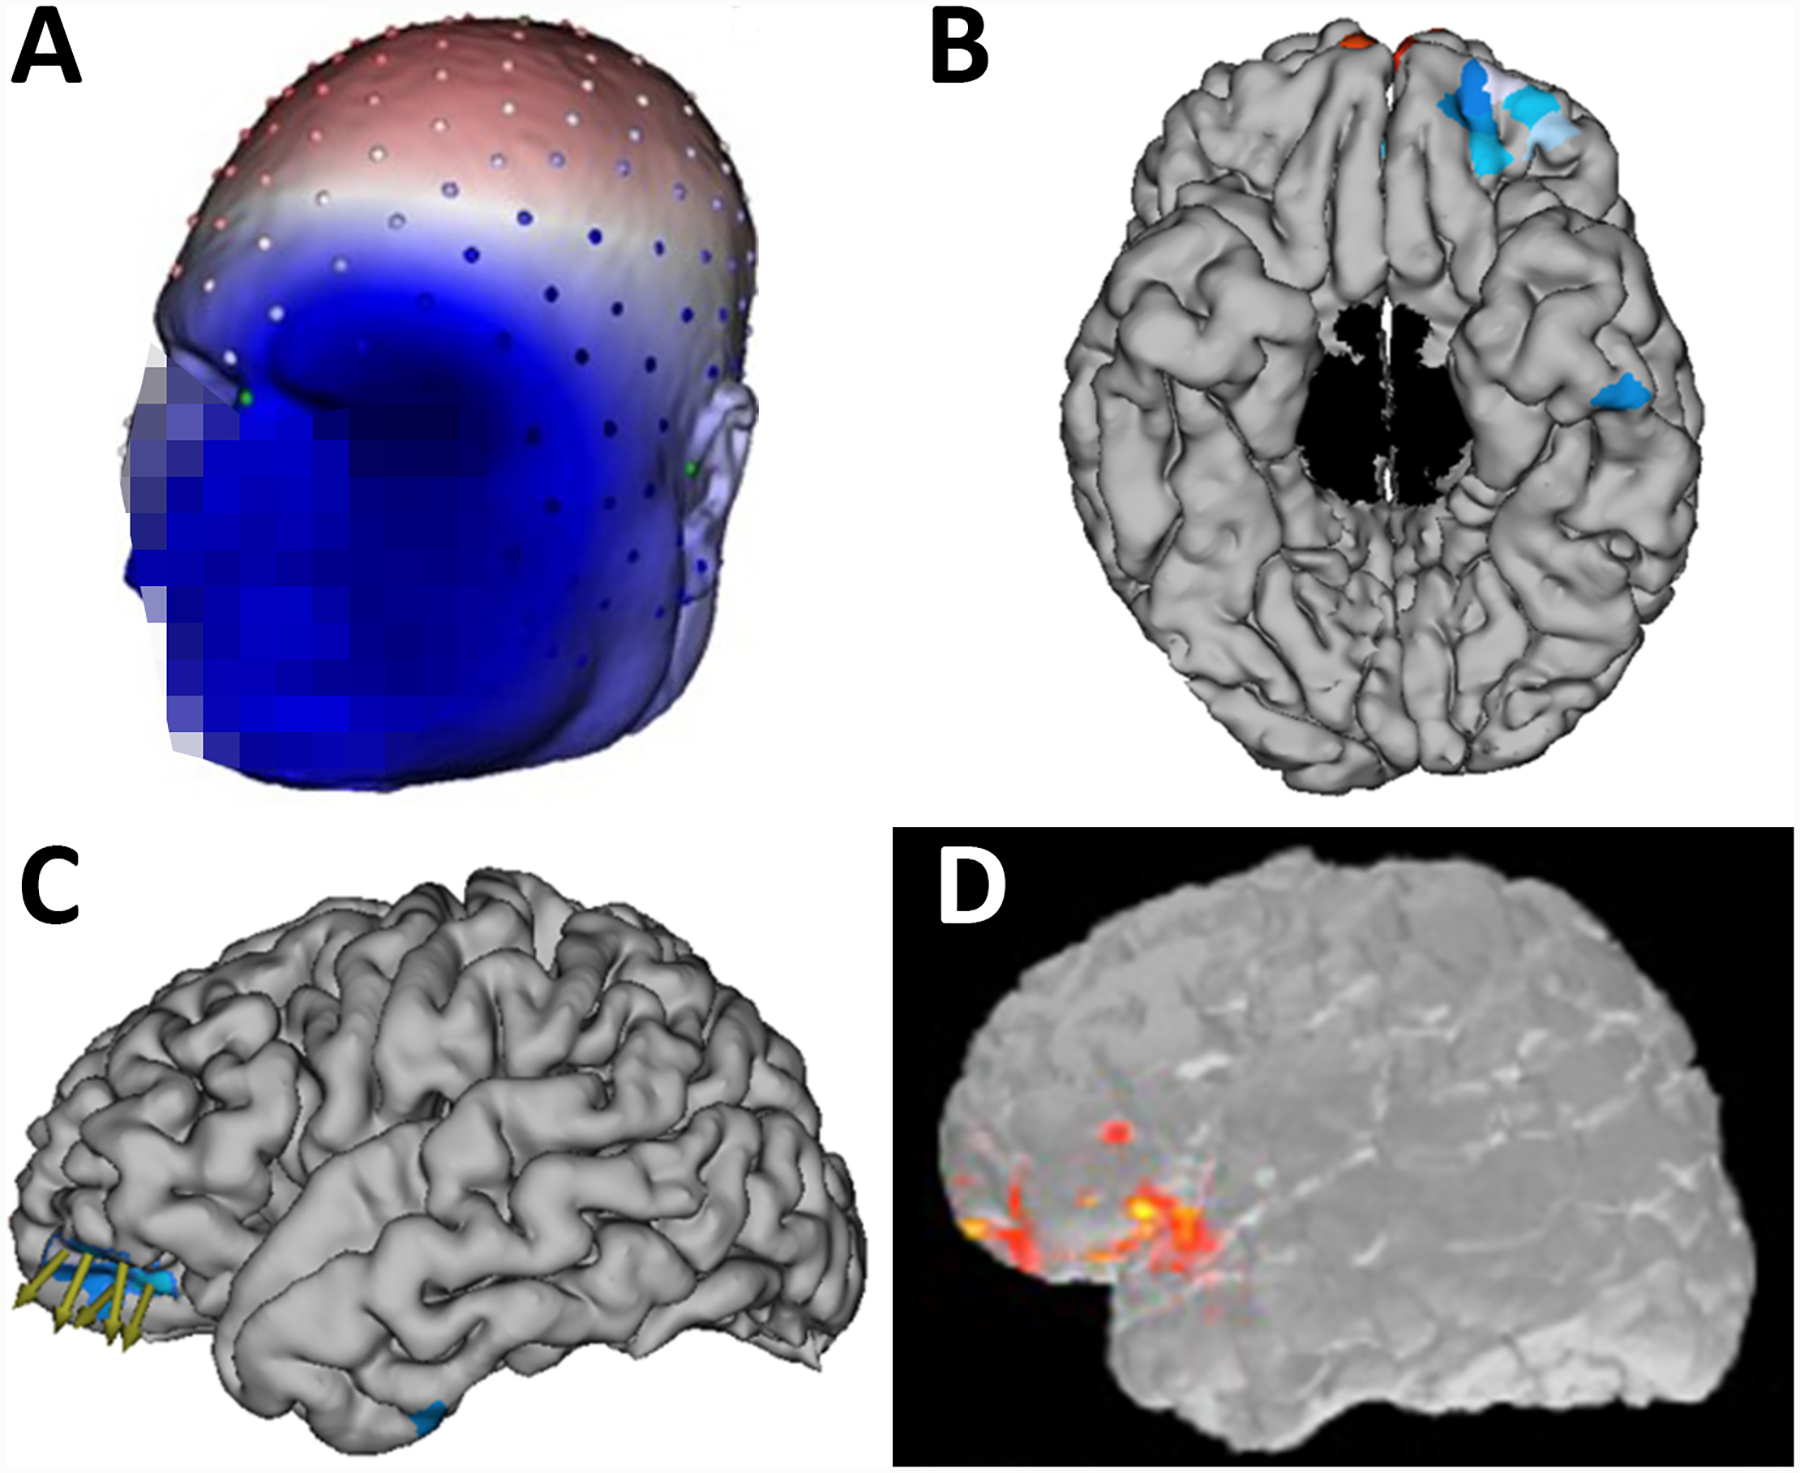
Figure 4.

A) Electrode coordinates co-registered to the individual head model were created using the patient’s MRI (face blurred for patient confidentiality). The projection on the scalp shows the voltage field of the group dipole projection from 10 averaged IEDs. The deep blue represents the negative pole and the red represents the positive pole. B-C) Electrical source imaging results created using FDM forward model and sLORETA and dipole mapping of the average IED peak. This localizes to the left basal frontal region. The cortical patches highlighted in blue represent the areas with highest current density. The green arrows depict the dipole direction of the highlighted patch. D) MEG source analysis using the MNE-C software package showed similar localization of IEDs in the left basal frontal region.
