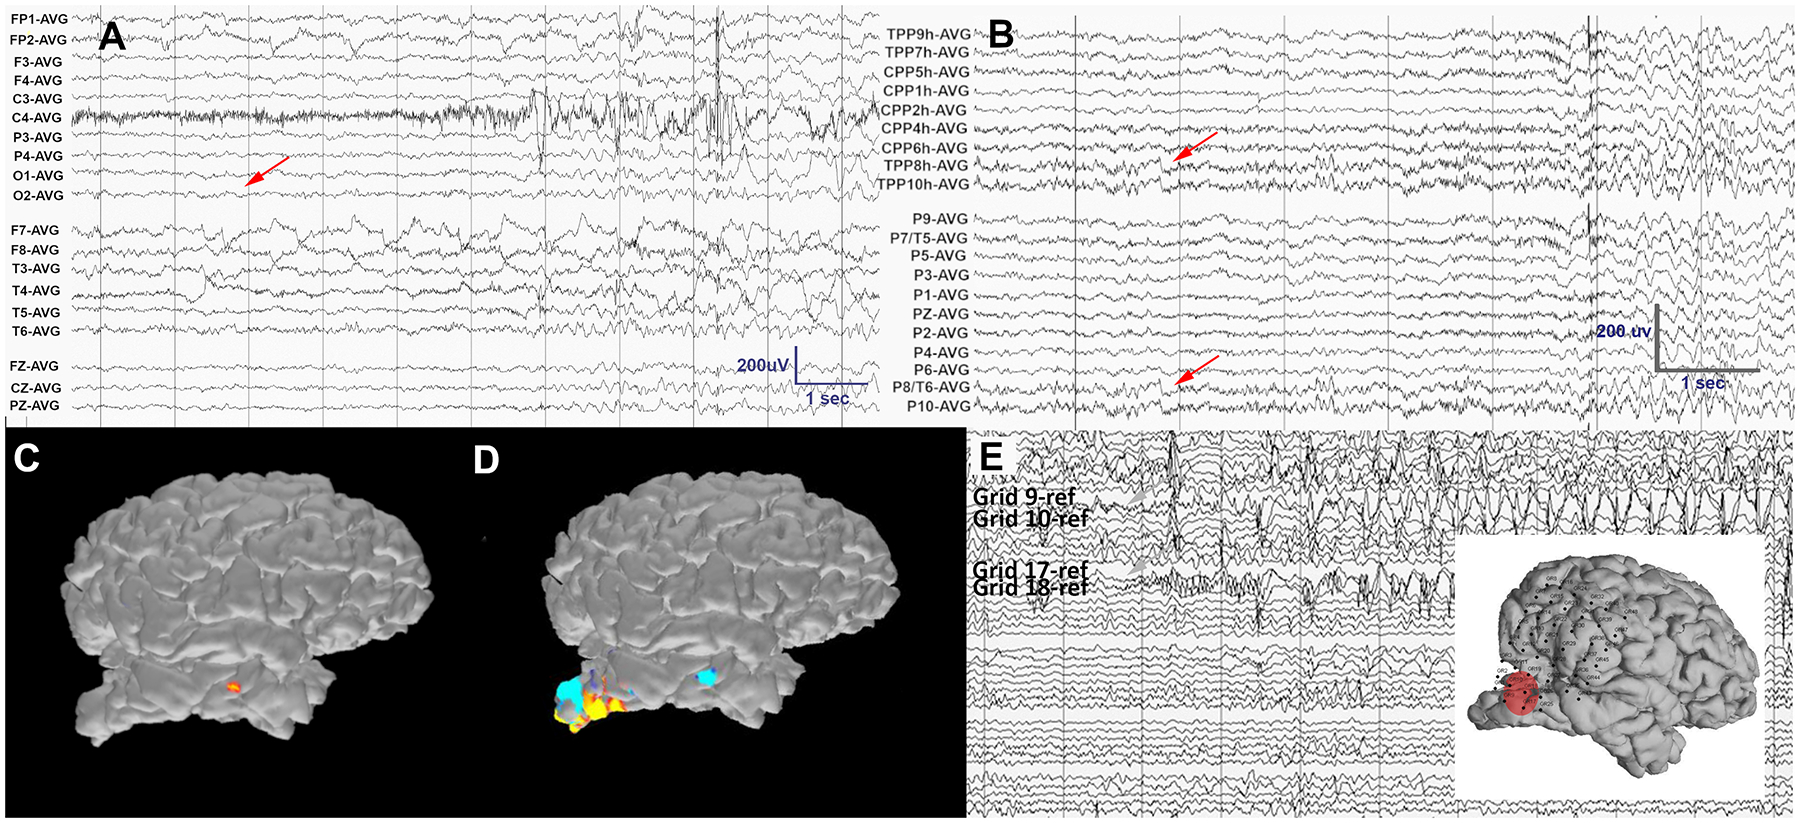
Figure 5.

A) On visual analysis of the LD-EEG recording, no electrographic correlate to the patient’s ictal clinical onset is evident (red arrow) due to sparse coverage of the area of interest and an artifact in remaining channels. B) Visual analysis of the HD-EEG (a subset of channels is shown) reveals the onset of subtle evolving rhythmic activity in the right temporo-occipital electrodes that coincides with the clinical event (red arrows). C) ESI of 3 average peaks of the early ictal rhythmic sharp activity evident on HD-EEG localized to the anterior temporal lobe using only LD-EEG data. D) ESI of the same events using HD-EEG data localizes to the inferior cortical margin of the occipital stroke cavity. E) A subset of invasive electrocorticography channels demonstrates seizure onset on grid contacts 9, 10, 17 and 18, corresponding upon visual review to the source estimated from the HD-EEG ESI (red circle in inset). The data were band pass filtered at 1–70Hz, with a notch filter at 60Hz.
