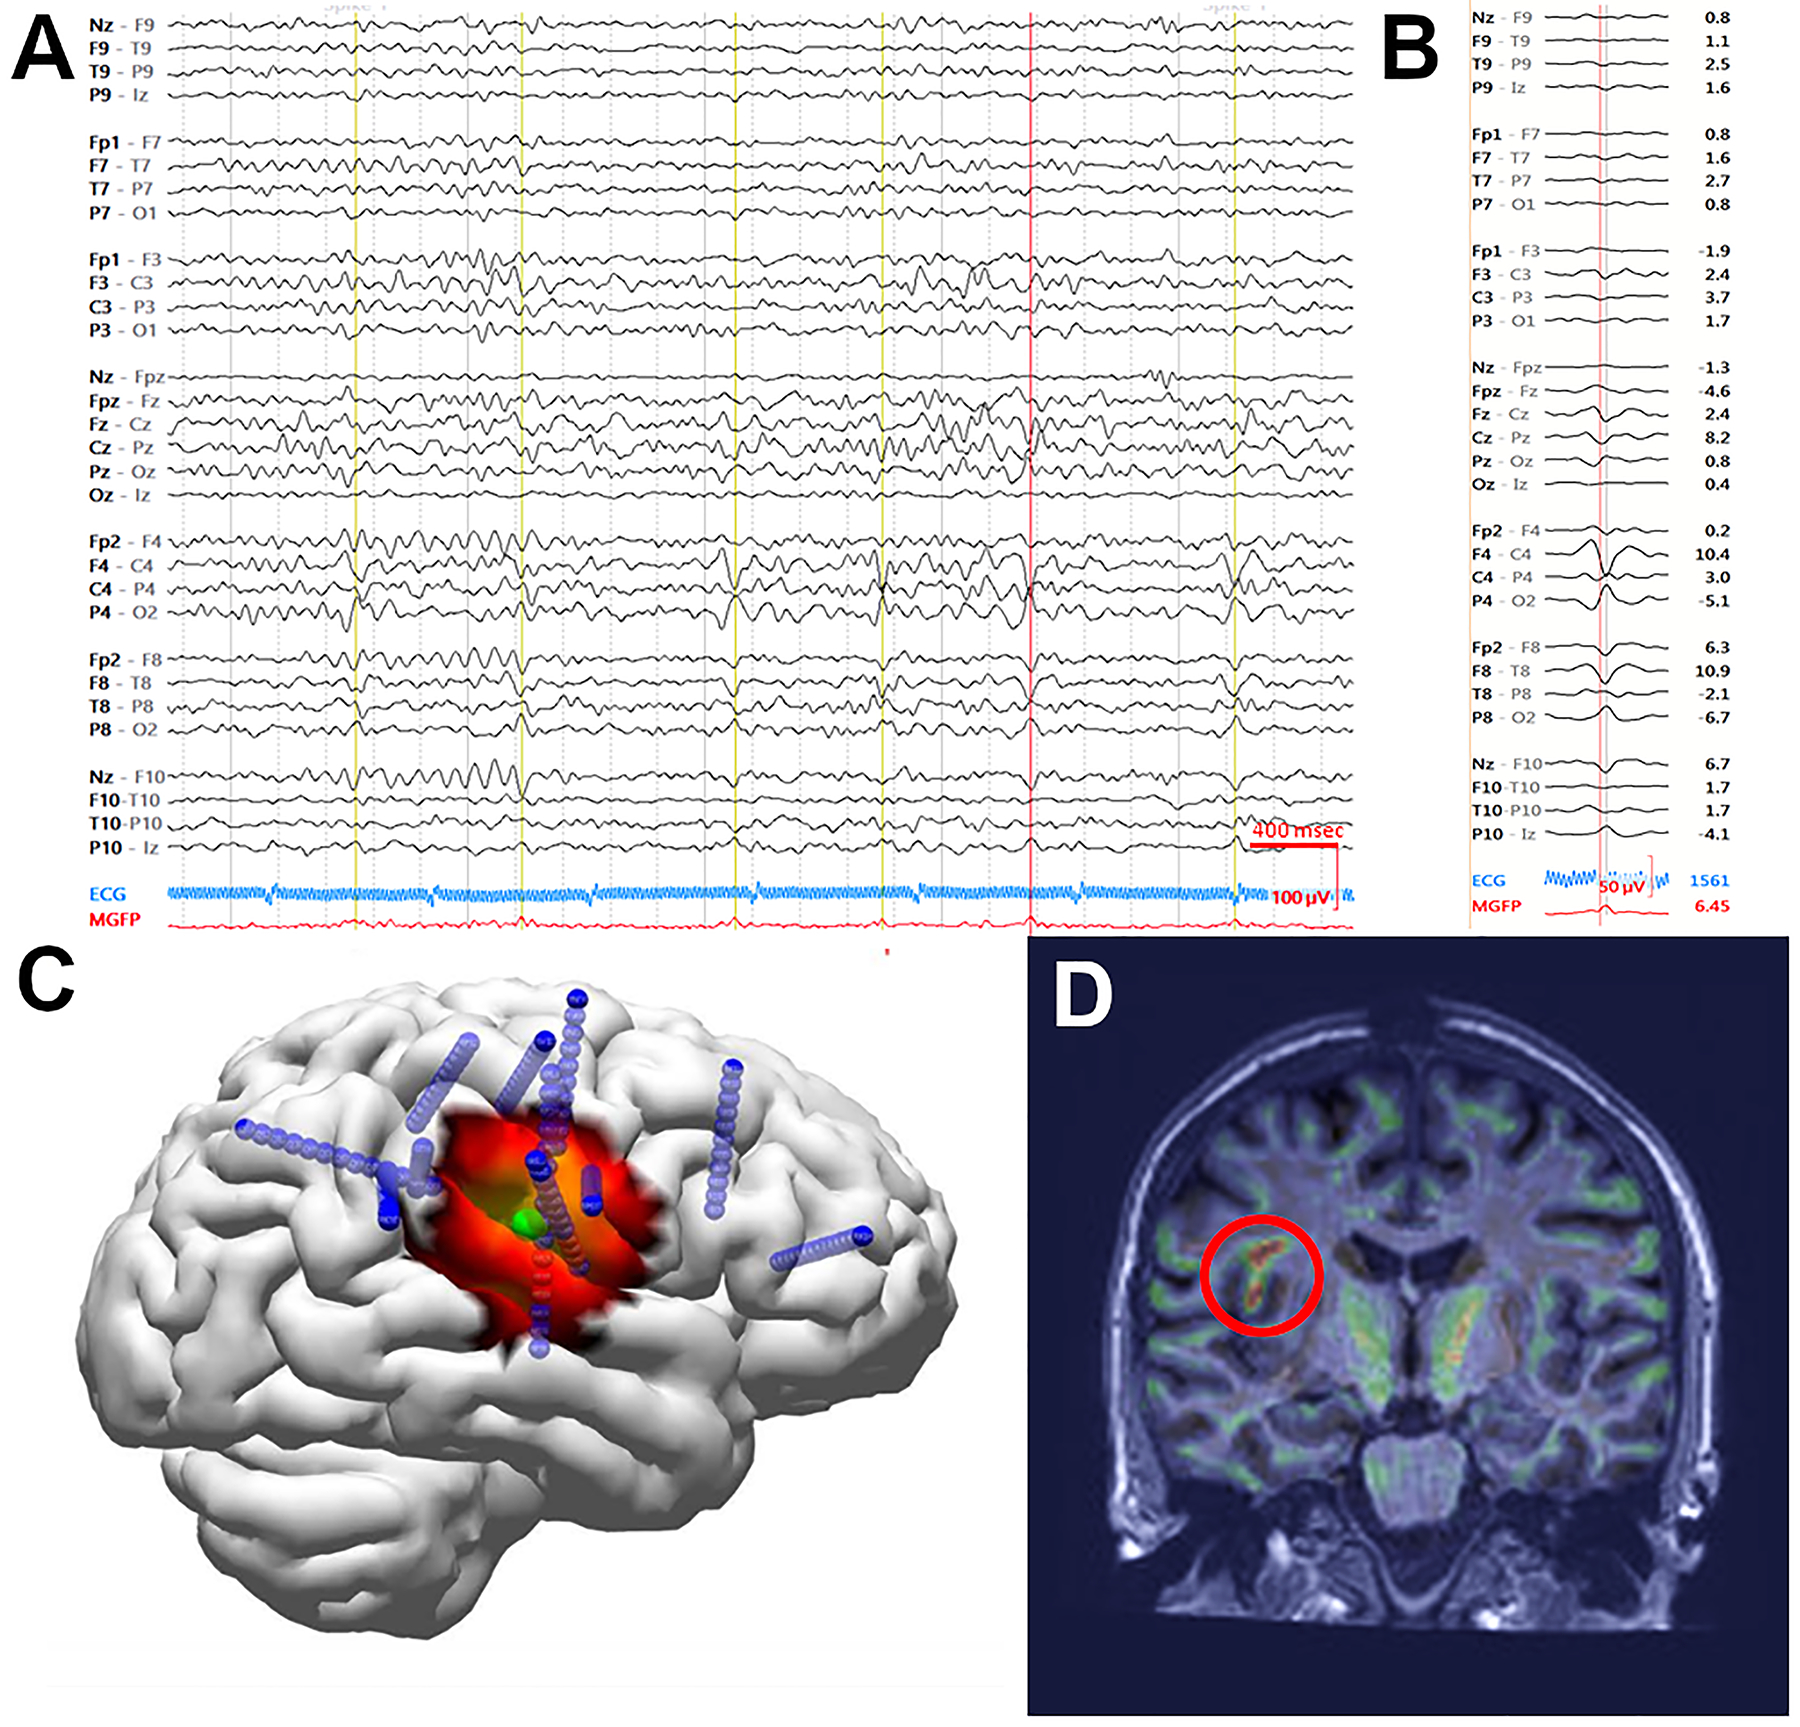
Figure 6.

A) An example of an HD-EEG recording showing abundant IEDs over the right centroparietal region. IEDs selected for averaging designated by vertical lines. Data were bandpass filtered from 2 to 55Hz. B) Voltage tracing of 39 representative IEDs averaged. C) Dipole (green) and ESI estimation (heat map, sLORETA) at the mid-point of the rising slope of the averaged IEDs both localized to the peri-Rolandic frontal operculum. Subsequent depth electrode placements are shown in blue. D) Morphometric analysis revealed an abnormality (red circle), co-localizing with the region indicated by HD-EEG and invasive recording.
