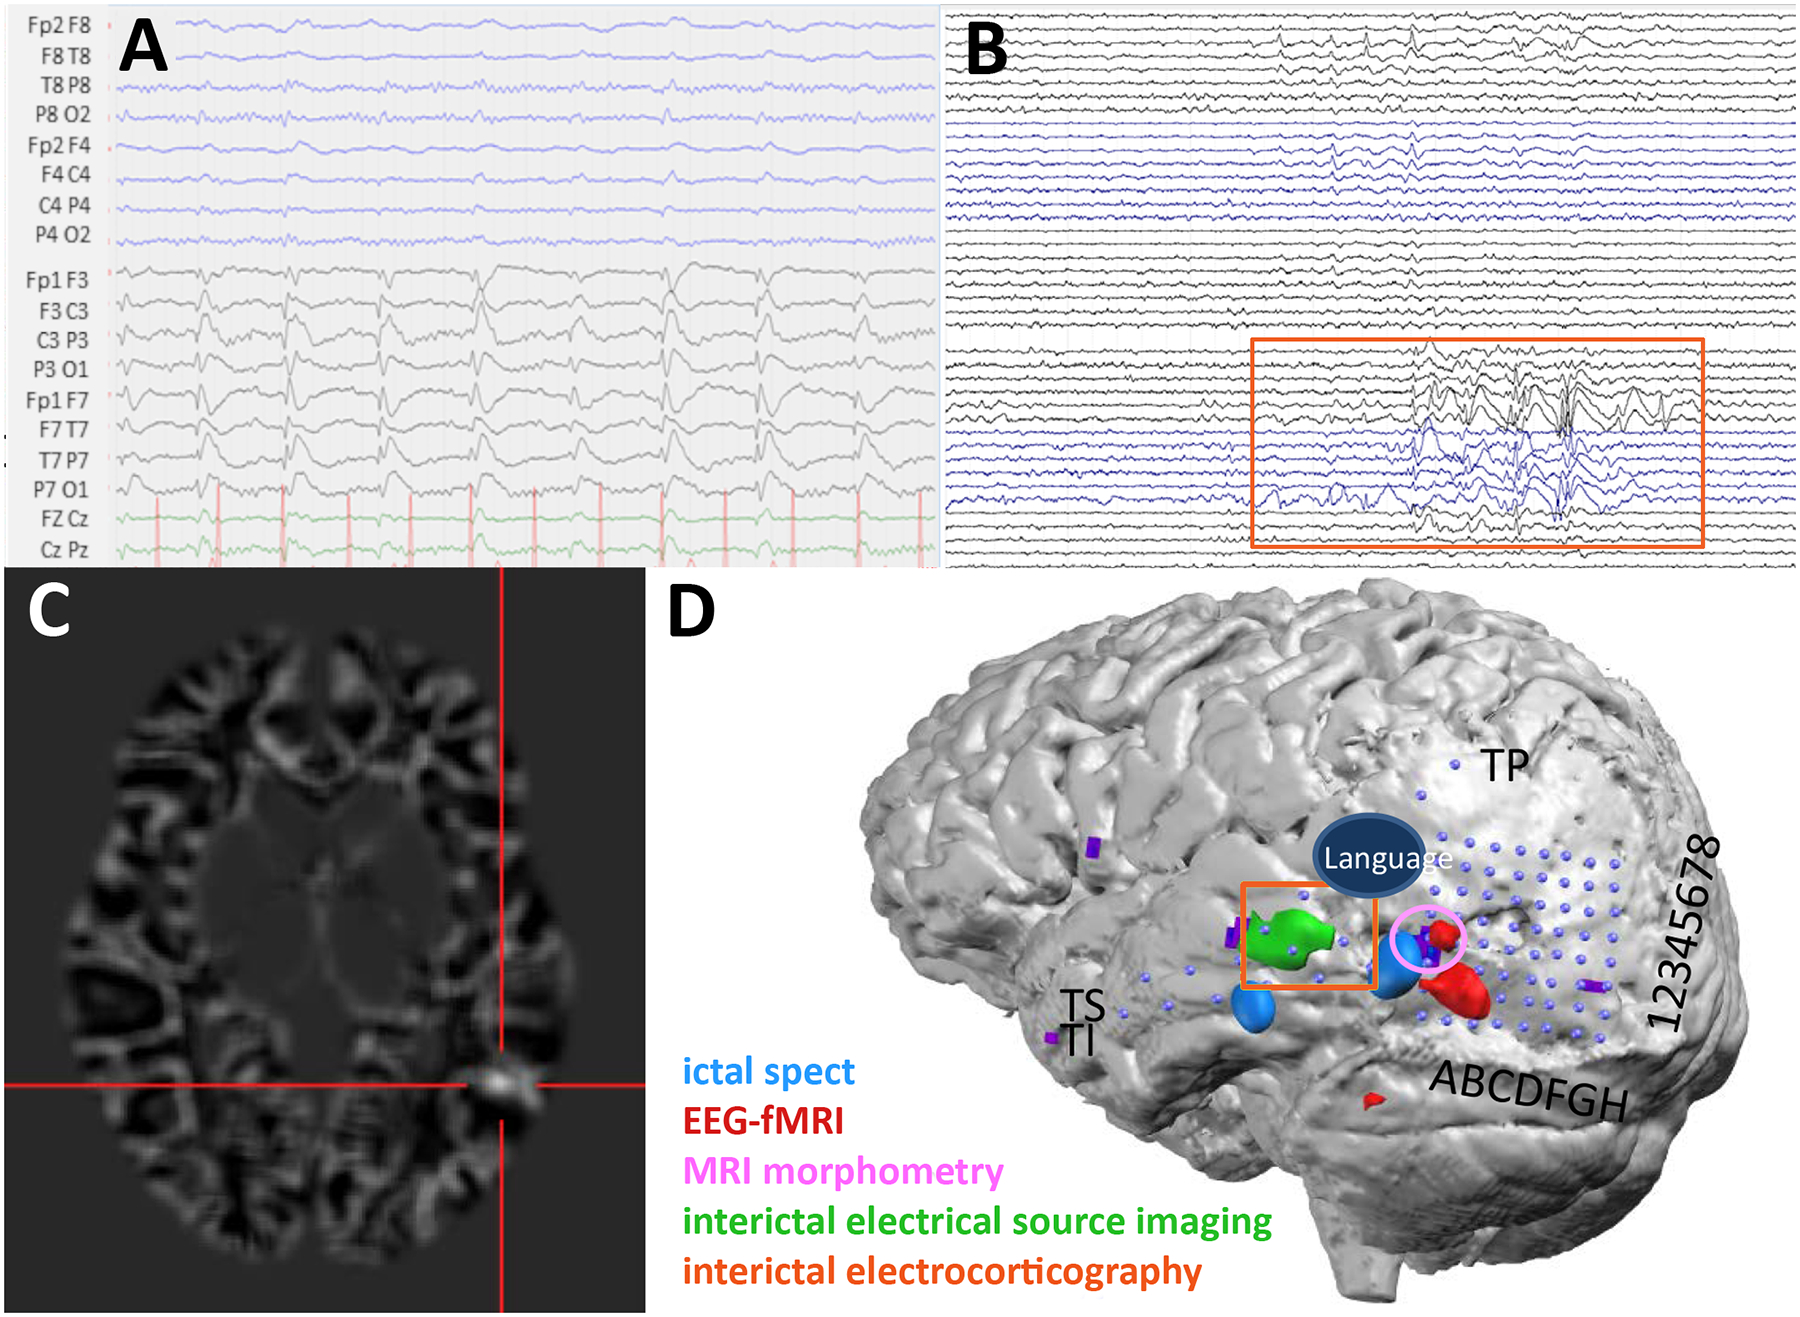
Figure 7.

A) The patient’s LD-EEG recording showing representative IEDs over the left hemisphere. Data were bandpass filtered from 0.53 – 70 Hz. B) IEDs on invasive subdural grids. Orange box corresponds to the active channels and their location in D (TI4–6, TS4–6, TP1–2). Data were bandpass filtered from 5–500 Hz. C) Subtraction ictal SPECT co-registered with MRI identifies a focus in the left posterior middle and inferior temporal cortex. D) Co-registration image showing the placement of the subdural electrodes (blue dots) and localization of the eloquent language cortex using corticography and the epileptiform cortex using multiple modalities. Localization of IEDs using ESI on HD-EEG data co-localized with the invasive subdural recordings and was anterior to the cortical dysplasia.
