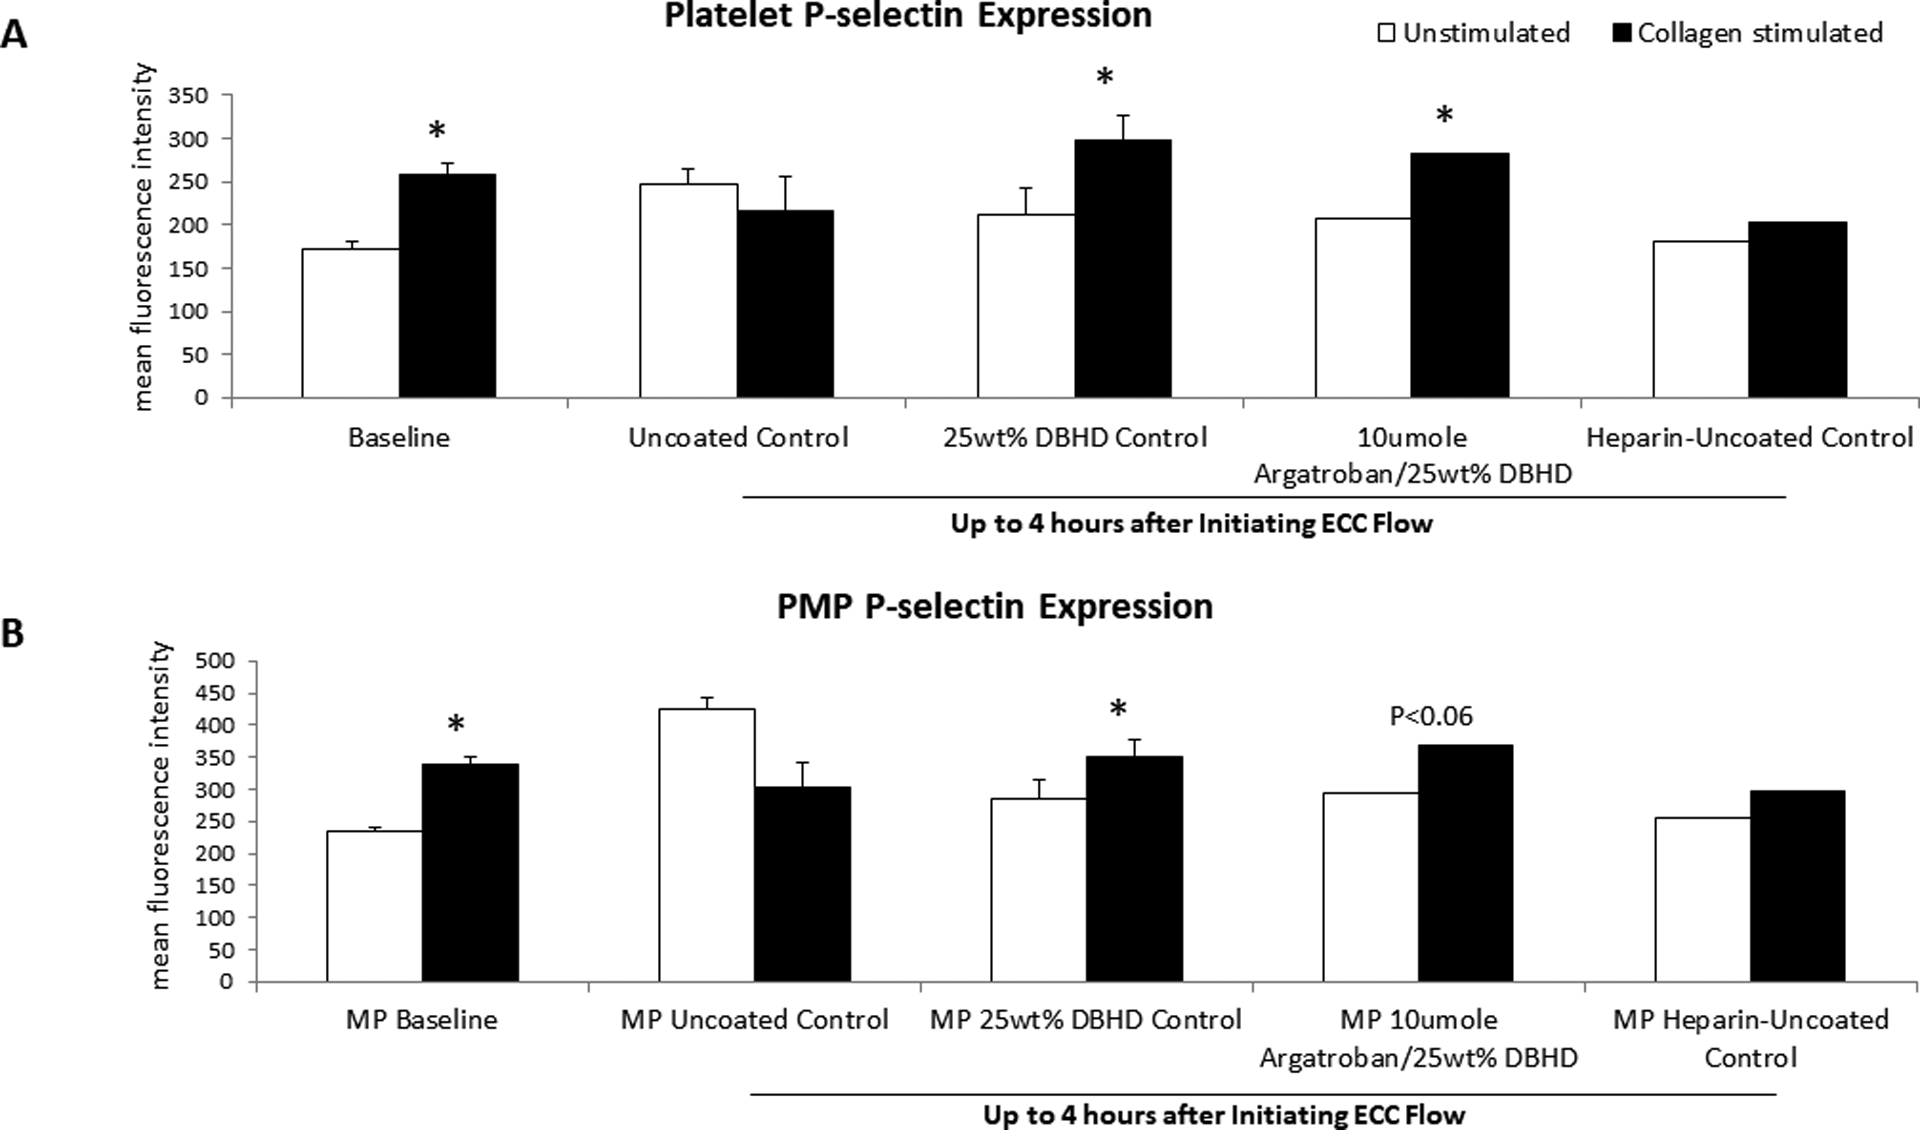
Figure 7.

Fluorescent-activated cell sorting (FACS) analysis for circulating platelets (A) and platelet microparticles (PMP) (B) P-selectin after 4 h blood exposure with combined argatroban/DBHD/N2O2, DBHD/N2O2 alone, systemic heparin-uncoated and uncoated control ECCs. Platelet and PMP P-selectin mean fluorescence intensity (MFI) was quantified after 4 h on ECC in NORel and control ECCs. The data are means ± SEM. * = p < 0.05, for baseline vs argaroban/DBHD/N2O2 ECC and DBHD/N2O2 alone polymer coatings. The specific MFI data is after the isotype control value was subtracted from each P-selectin MFI value. All FACS analyses used the gated FSC/SSC plot for platelets and PMPs using 100 μl of diluted whole rabbit blood (1:100) for each determination.
