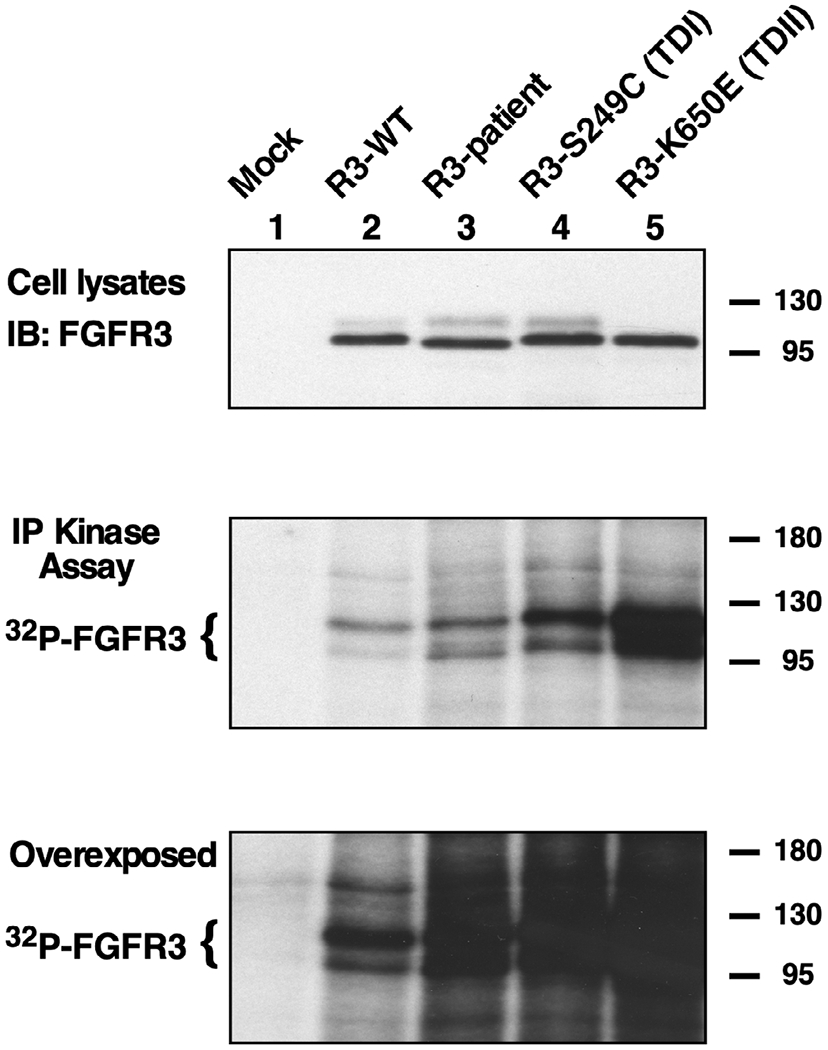
FIGURE 5.

In vitro tyrosine kinase activity. Total expression of FGFR3 derivatives from HEK293T cells is shown by immunoblotting (top panel). FGFR3 immunoprecipitates were subjected to in vitro kinase assay with γ-32P-ATP. Samples were resolved by 7.5% SDS-PAGE and autoradiography (middle and bottom panels). The overexposure shown (bottom panel) is included to demonstrate the relative similarity of kinase activity in Lanes 3–5, showing the patient mutation together with a TD I and a TD II mutant, in comparison with FGFR3-WT in Lane 2
