
Figure 2.
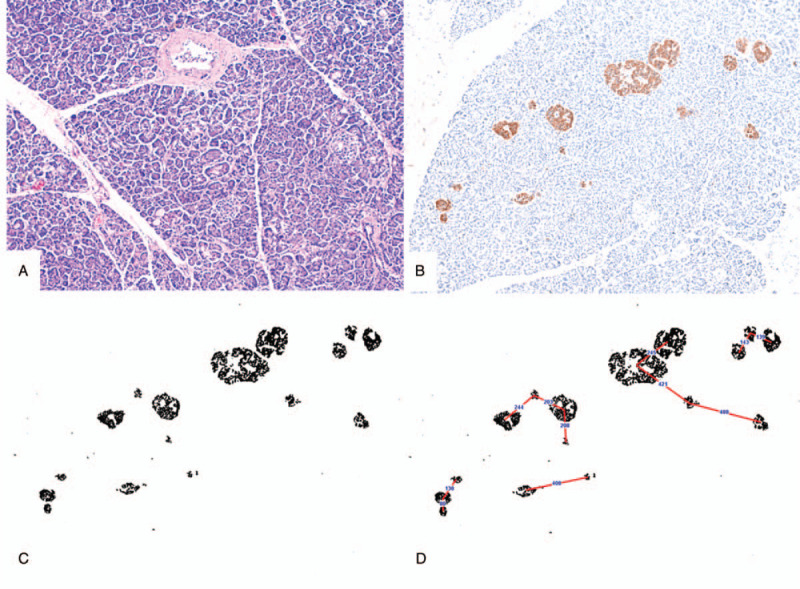
(A) Hematoxylin and Eosin-stained section showing pancreatic islets and acini without features of autolysis; (B) a single representative field of IHC image, stained by an anti-synaptophysin antibody from B1 segment of a pancreas; (C) processed image – segmentation of DAB positive area in ImageJ software; (D) schematic representation showing how the ImageJ software calculated the IID – centre of each islet to the centre of the nearby islet. Images B, C, and D are at same magnification for better comparison. IHC = immunohistochemistry, IID = inter-islet distance