. 2021 Jan 15;2(1):230–240. doi: 10.1039/d0cb00142b

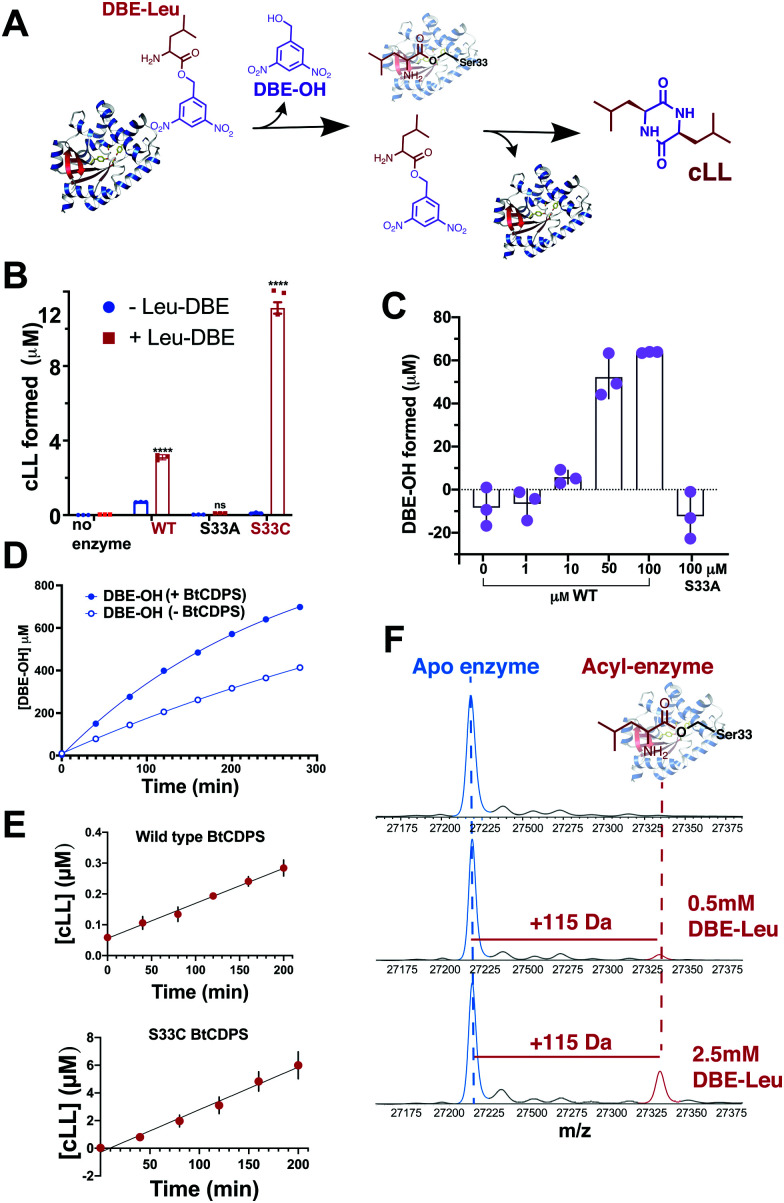
Fig. 3. Small molecule, Leu-DBE, is a substrate of BtCDPS (A) Reaction scheme when utilising Leu-DBE as a substrate. (B) Leu-DBE assay depicting the levels of cLL (m/z = 227.175) detected by LC-HRMS. B and C are reactions performed overnight in the presence (+) or absence (−) of Leu-DBE, using wild type (WT) or active site mutants S33A and S33C. **** depicts significant differences between + and − experiments. (C) Integrated DBE-OH peaks show production dependant on concentration of enzyme. (D) Time course for DBE-OH formation in the presence (half life, t1/2 = 182 min) and absence (t1/2 = 431 min) of BtCDPS. Solid line is a fit to an exponential equation to obtain t1/2. (E) Time course for cLL formation catalysed by wild type and S33C BtCDPS. (F) Intact mass spectrometry of wild type BtCDPS shows the accumulation of a leucyl-enzyme intermediate (mass increase of +115) with increasing concentration of Leu-DBE substrate in assay. Accumulation is not observed when using S33A and S33C (Fig. S16). n = 3 independent experimental replicates for Leu-DBE assays.

Fig. 3