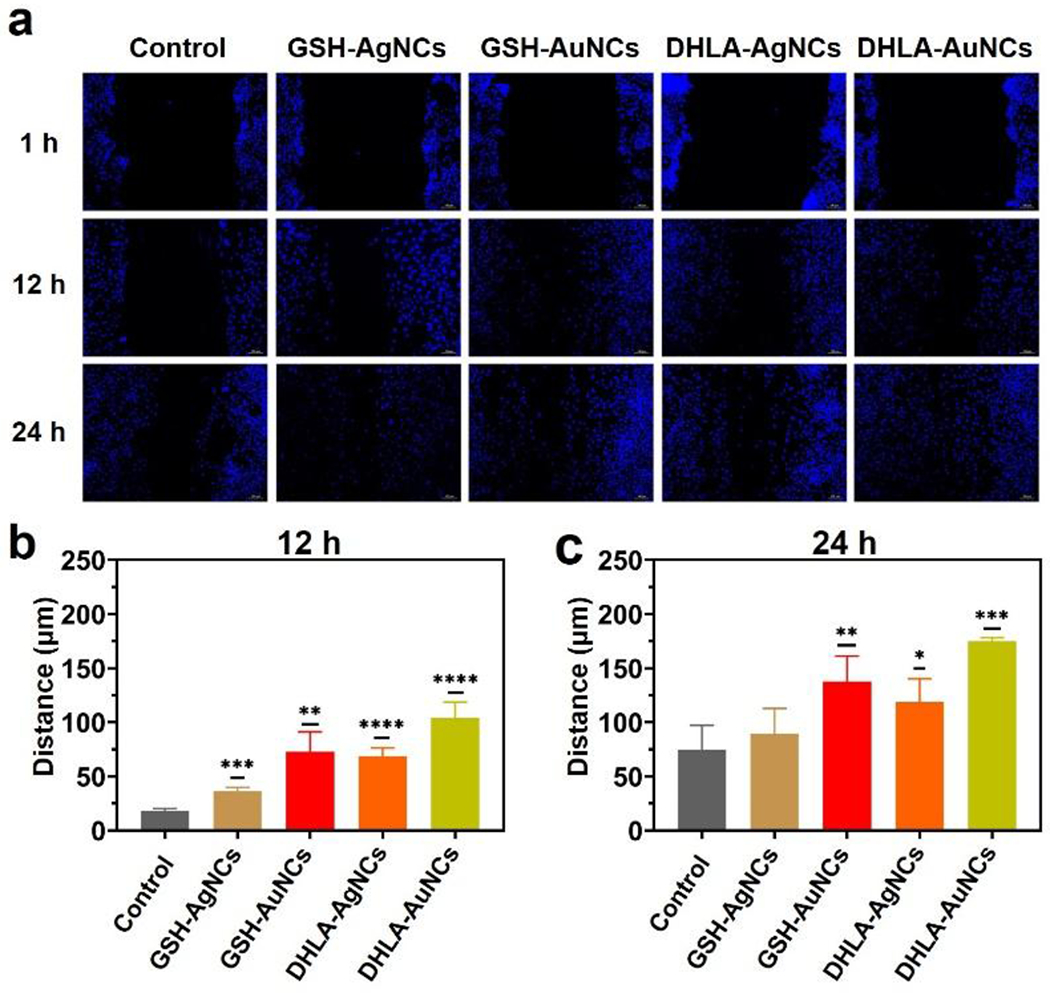
Figure 2.

Effects of the different NCs expression on HUVECs cells migration. (a) Representative fluorescence images of the wound-healing assay were captured at 12 h and 24 h after wounding with or without drug treatment. Migration distance of in-vitro scratch assay at (b) 12 hours and (c) 24 hours. Data from all four experiments are presented as mean ± SD. *P < 0.05,**P < 0.01, ****P < 0.001, ****P < 0.0001.
