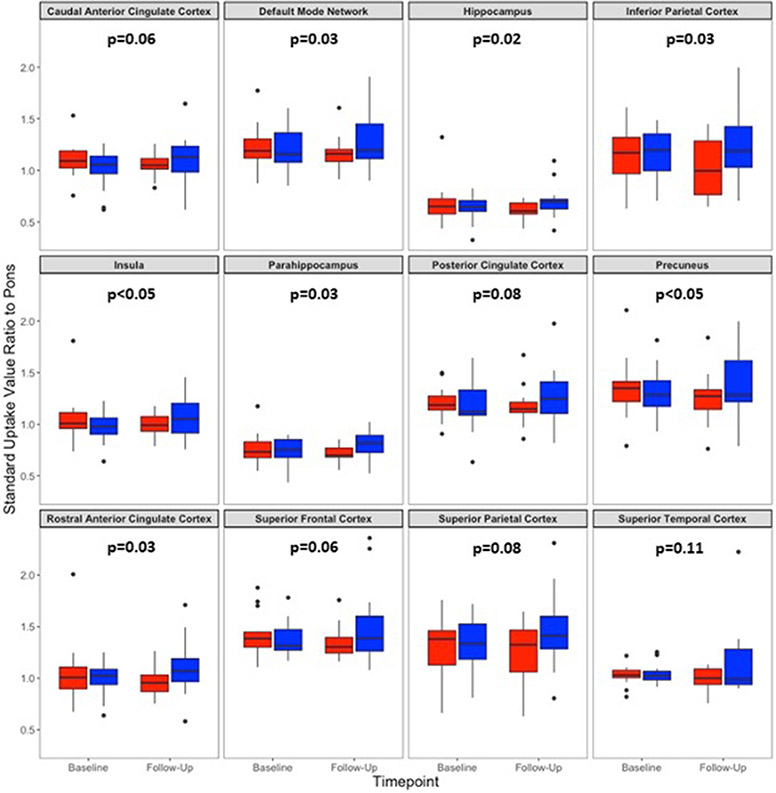
Figure 1. Dose by timepoint FDG PET SUVR by region of interest.
The box and whiskers plots illustrate pre- and post-treatment SUVR values across 12 regions. The lower dose is shown in red, and the higher dose in blue. P values were determined using a linear mixed-model approach and reflect the significance of the primary effect of interest, the dose by time interaction. They were obtained by likelihood ratio tests of a full linear mixed model of OAA dose and study timepoint. This was tested against a reduced model without the interaction. P values between 0.045 and 0.049 are designated as <0.05; for other values the rounded decimal is indicated. The DMN values are a composite average of superior parietal cortex, precuneus, posterior cingulate cortex, and rostral anterior cingulate cortex measurements.

