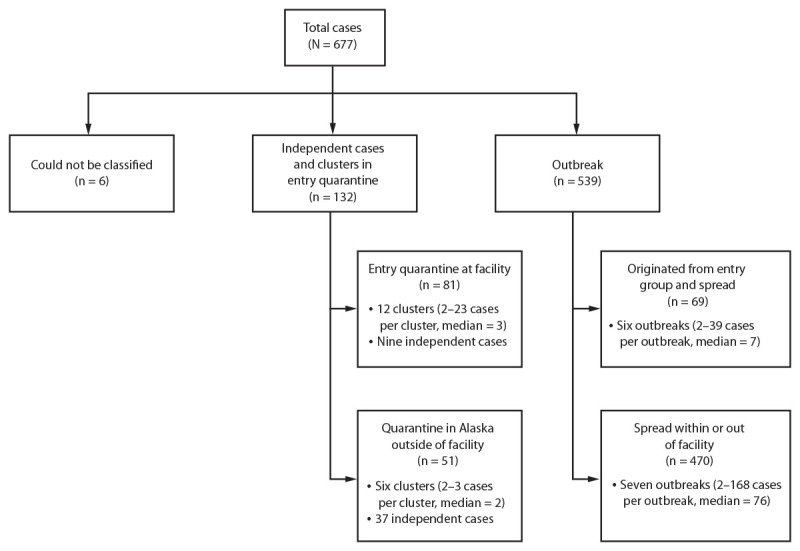
FIGURE.

Laboratory-confirmed cases*,† of COVID-19 associated with the seafood processing industry§ — Alaska, March 1–October 13, 2020
* Clusters include those determined to include person-to-person transmission within an entry quarantine group.
† Independent cases were not known to have transmitted SARS-CoV-2 to others.
§ The source of the spread within or outside of facility was unknown.
