
FIGURE.
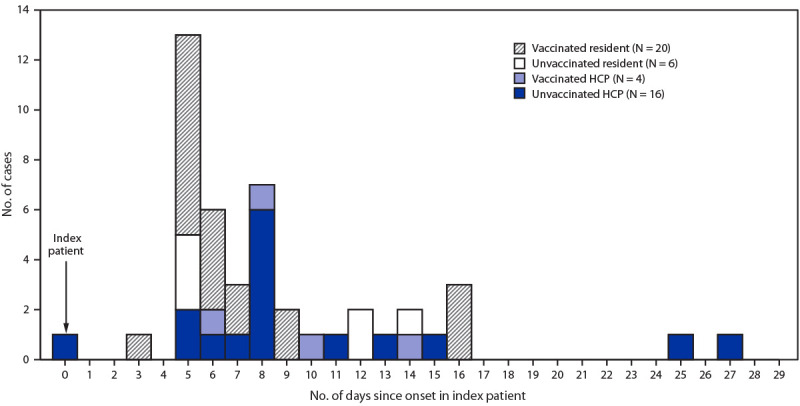
SARS-CoV-2 illness onset* among residents and health care personnel (HCP) in a skilled nursing facility, relative to onset in the index patient, by vaccination status† — Kentucky, March 2021
* Symptom onset date or specimen collection date, if asymptomatic.
† Persons who received 2 doses of Pfizer-BioNTech vaccine are indicated as vaccinated; unvaccinated persons received no vaccine doses. Persons who received a second dose of vaccine <14 days before outbreak onset (four residents and five HCP) and those who received only a single dose of vaccine (one HCP) were excluded from the primary analysis; this resulted in exclusion of two cases that occurred in residents.