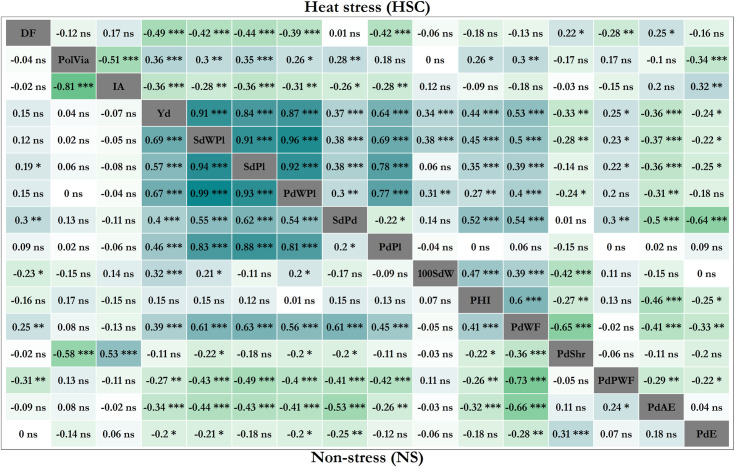
Fig 5.
Phenotypic trait correlations in the IJR x AFR298 population, in non-stress (NS, lower left) and heat stress conditions (HSC, upper right). For abbreviations see Table 1. Pearson correlations shown with significance levels *, **, *** as p values > = 0.05, 0.01 and 0.001, respectively.

