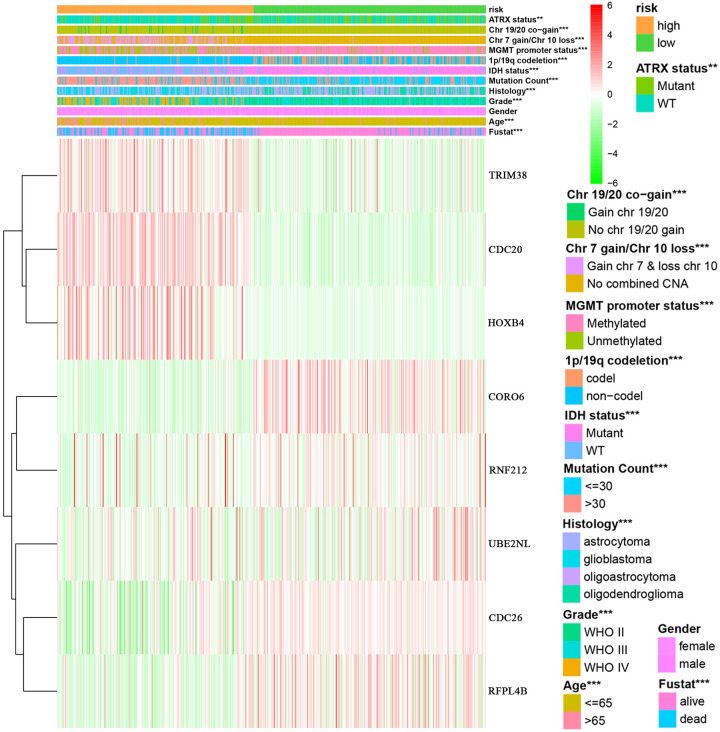
Fig 8. Relationship between risk groups and clinical traits.
Analysis of the relationship between high and low risk groups and common clinical traits, including ATRX status, Chr 19/20 co-gain, Chr 7 gain/Chr 10 loss, MGMT promoter status, 1P/19q co-deletion, IDH status, mutation count, histology, grade, gender, age, and fustat. Gender and risk groups showed no correlation. TRIM38, CDC20, HOXB4 and other genes are the genes for constructing risk models. Red represents high expression, green represents low expression, and white represents intermediate expression. **p<0.01, ***p<0.001.

