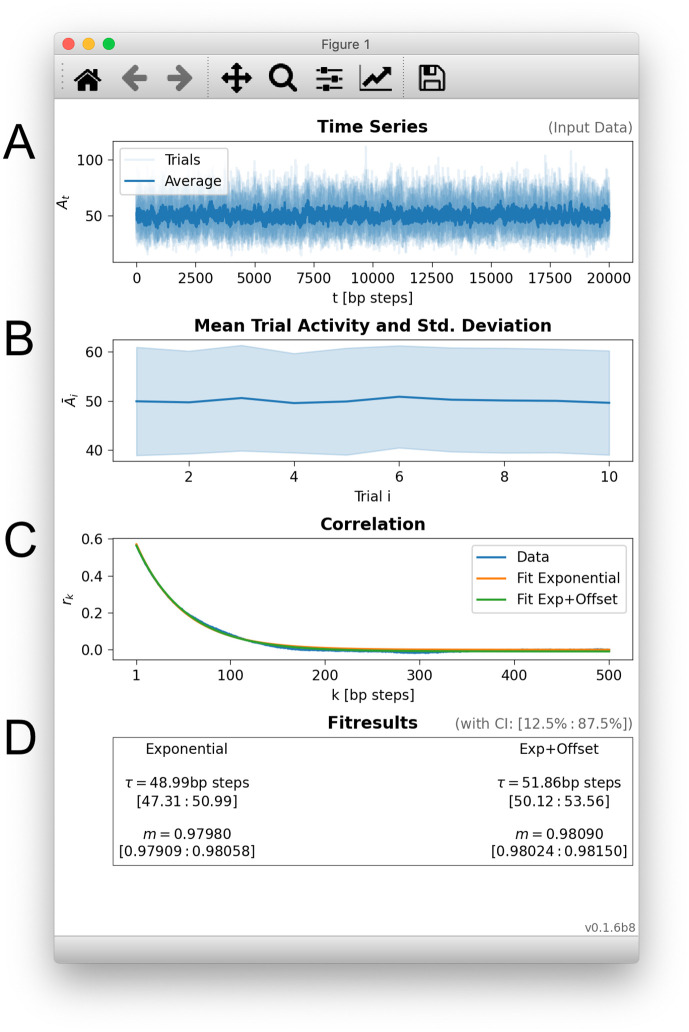
Fig 1. The toolbox provides a full_analysis() function that performs all required steps and produces an overview panel.
A: Time series of the input data, here the activity At of ten trials of a branching process with m = 0.98 and τ = Δt/ln(m) ≈ 49.5 steps (Δt is the step size of the branching process). B: Mean activity and standard deviation of activity for each trial. This display can reveal systematic drifts or changes across trials. C: Correlation coefficients rk are determined from the input data, and exponentially decaying autocorrelation functions are fitted to the rk. Several alternative fit functions can be chosen. D: The decay time of the autocorrelation function corresponds to the intrinsic timescale τ, and allows to infer the corresponding branching parameter m. The shown fit results contain confidence intervals in square brackets (75% by default).

