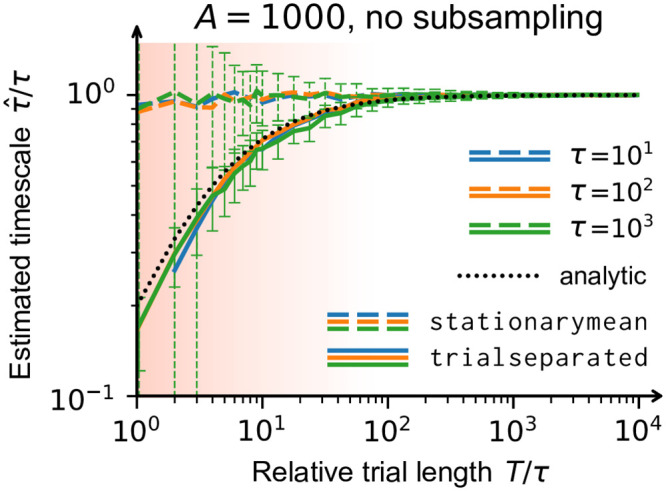
Fig 5. Independent of subsampling, correlation coefficients can be biased if trials are short.

As a function of trial length, the autocorrelation time that was estimated by the toolbox () is compared with the known value of a stationary, fully sampled branching process (τ). Each measurement featured 50 trials and was performed once with each method, trialseparated (solid lines) and stationarymean (dashed lines). For short time series (red shaded area), it is known analytically that the correlation coefficients are biased [23]. The bias propagates to the intrinsic timescale (black dotted line) and it is consistent with the timescale obtained from the trialseparated method. The stationarymean method can compensate the bias, if enough trials are available across which the activity is indeed stationary. However, the improvement to the estimates scales directly with the number of trials—the effective statistical information is increased with each trial. Error bars (for clarity only depicted for τ = 103): standard deviation across 100 simulations. For more details, see appendix B.
