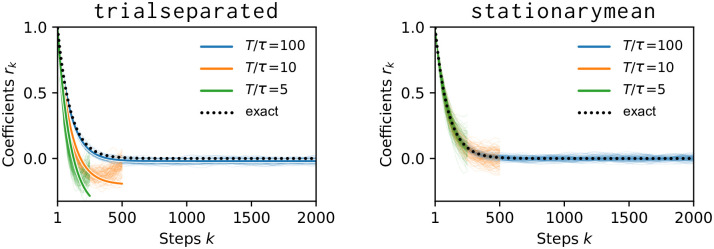
Fig 6. Correlation coefficients rk for τ = 102 (orange in Fig 5).
Individual background lines stem from the 100 independent repetitions.Left: Coefficients are shifted and skewed for short trial length T/τ when using the trialseparated method. The solid foreground lines are obtained from Eq. 4.07 of [23]. Right: With 50 trials and the stationarymean method, even very short (green) time series yield unbiased coefficients and, ultimately, precise estimates of the intrinsic timescale.

