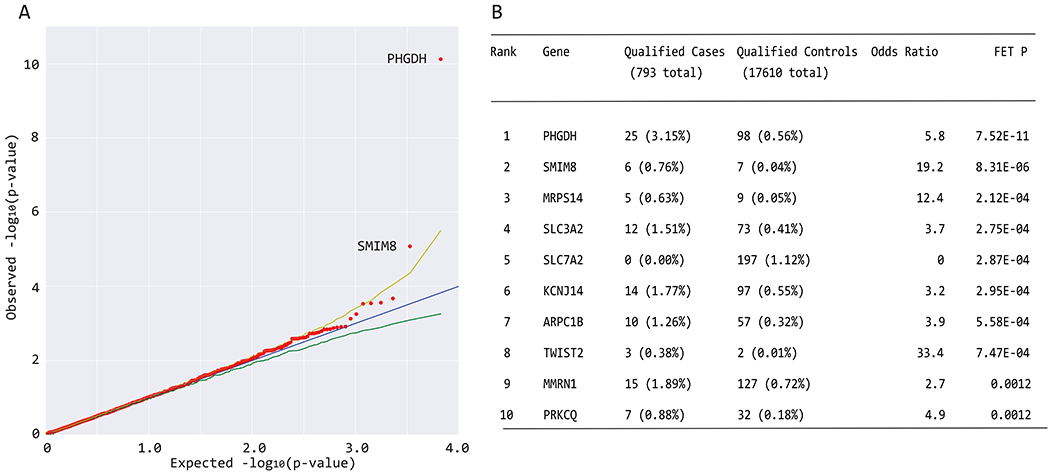
Figure 1. Collapsing analysis identifies PHGDH as a MacTel gene.

(a) Quantile-quantile (QQ) plot for exome-wide gene-based collapsing analysis under the dominant genetic model with MAF<0001 and REVEL>0.5 filters. The y-axis represents the −log10 of the observed two-sided Fisher’s exact test (FET) p-values (sorted). The x-axis represents the −log10 of the permutation-based expected FET p-values (sorted). The red dots represent the data points, while the blue line is the diagonal with slope 1. The green and yellow lines represent permutation-based 95% confidence intervals. Data points falling outside the 97.5th percentile bound are labeled with corresponding gene symbols. PHGDH reached study (genome)-wide significance, SMIM8 association was borderline. (b) The top 10 genes from collapsing analyses under the same model are shown, including the exact numbers of all qualifying cases and controls and statistical calculations of association (OR and FET P).
