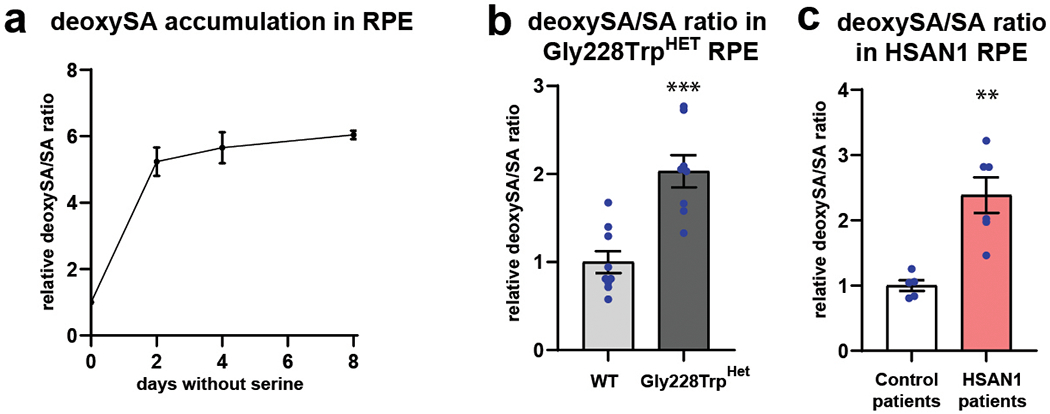
Extended Data Fig. 6. deoxySA/SA ratios.

a) DeoxySA/SA ratios following 2, 4, and 8 days of culturing control iPSC-RPE in serine and glycine free media. Each time point run in triplicate. Error bars SEM. (b) Relative intracellular deoxySA/SA ratios in WT and PHGDH p.Gly228Trp iPSC-RPE following 2 days in serine and glycine free media. Data represented as mean of nine WT and eight PHGDH p.Gly228Trp replicates from three independently derived clones. (c) Relative intracellular deoxySA/SA ratios in control patient and HSAN1 patient iPSC-RPE following 2 days in serine and glycine free media. Data represented as the mean of five independently derived iPSC-RPE clones from two control patients and six independently derived iPSC-RPE clones from two HSAN1 patietns. Error bars SEM. **p<0.01 unpaired two-tailed T-test. (b) p=0.0002. (c) p=0.0015.
