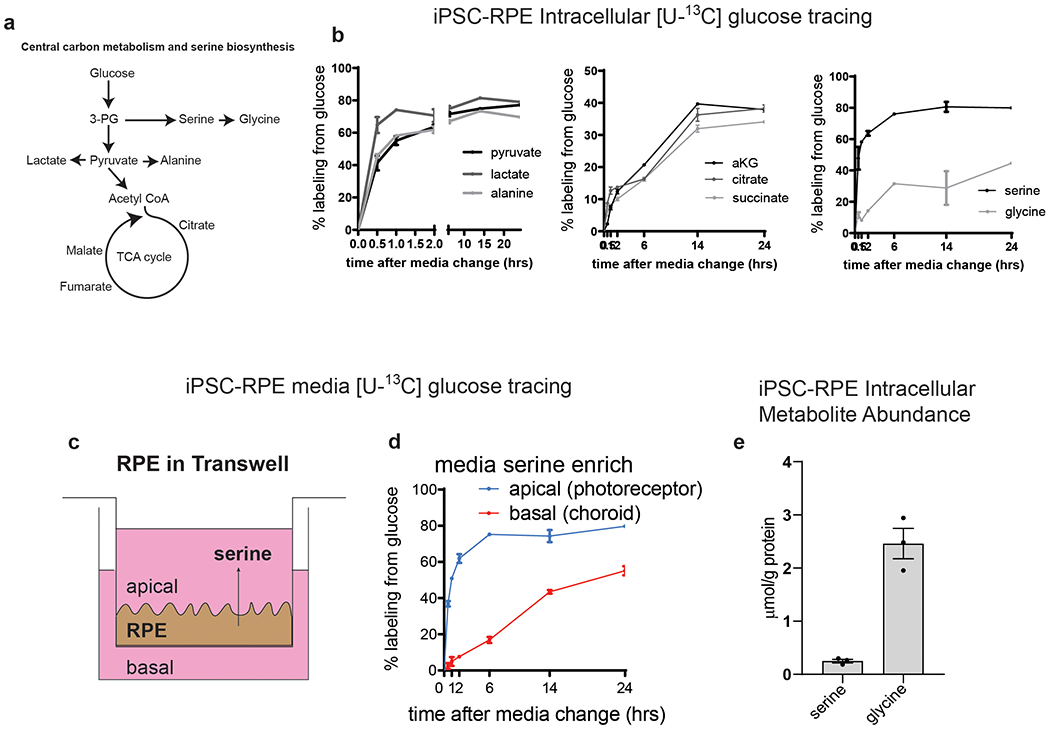
Extended Data Fig. 4. Metabolite tracing.

a) Schematic illustrating key metabolites in central carbon metabolism. b) % labeling of central carbon metabolites from [U-13C] glucose in cell pellet of iPSC-RPE. Points are the mean of three separately run wildtype iPSC-RPE samples. Error bars are +/− SEM. c) Schematic showing basal and apical secretion of metabolites from iPSC-RPE in transwells. d) Apical (blue) and basal (red) media measurements of serine from iPSC-RPE. e) Mean intracellular abundance of serine and glycine in wildtype iPSC-RPE. n=3 independent clones of wildtype iPSC-RPE. Error bars are +/− SEM.
