
Extended Data Fig. 5. Isotopologue distribution.
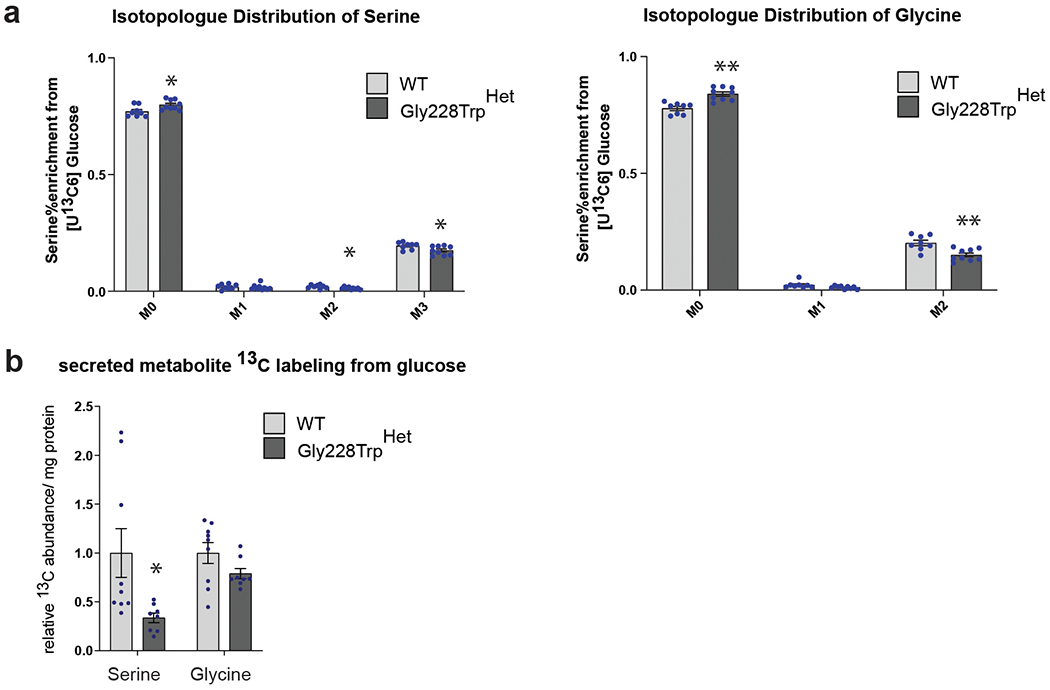
a) Isotopologue Distribution of U-13C from glucose in serine and glycine. b) Relative abundance of 13C isotope in fully labeled serine (M3) and glycine (M2) from [U-13C6] glucose in cell culture media (secreted) between WT and PHGDH p.Gly228TrpHET iPSC-RPE over a period of 24 hours. (a,b) Data shown as the mean of nine WT and eight PHGDH p.Gly228Trp replicates from three independently derived clones. Error bars +/− SEM. *p>0.05, **p>0.01 with unpaired two-tailed T-test. (a) serine: M0 p=0.02, M2 p=0.04, M3 p=0.03; glycine: M0 p=0.0002, M1 p=0.052, M2 p=0.002. (b) serine p=0.03.