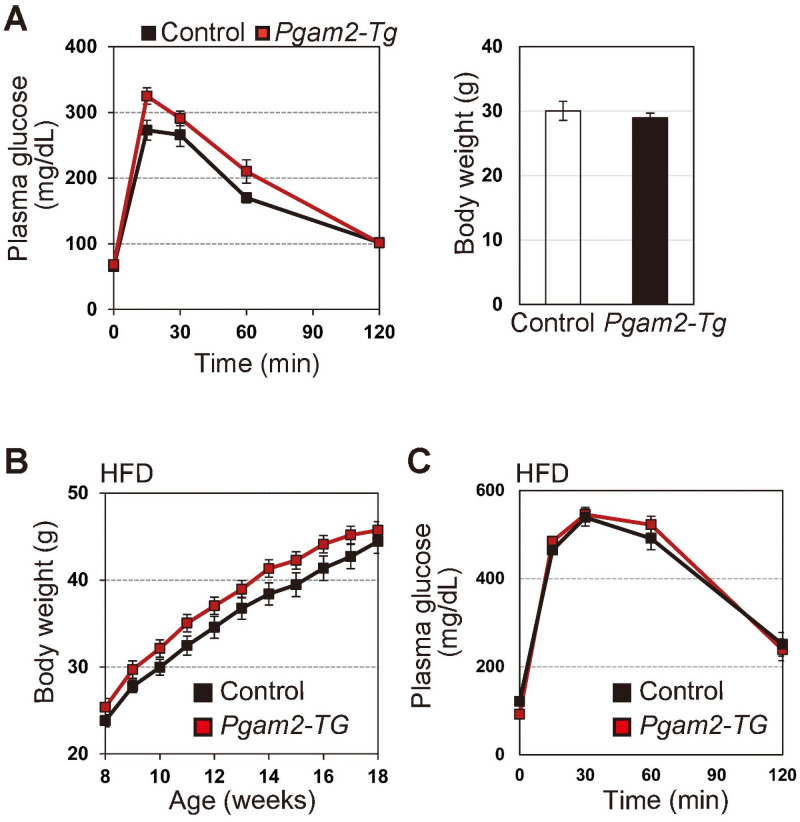
Fig 4. Glycolytic profiles in PGAM2-Tg mice.
(A) Intraperitoneal glucose test (IPGTT) was performed in control (wild-type) (n = 10) and Pgam2-Tg mice (n = 8) (Left panel). Body weight was measured at 18 weeks (Right panel). (B and C) High-fat diet (HFD) protocol was performed to induce obesity in control (n = 9) and Pgam2-Tg mice (n = 7). (B) Body weight was monitored during the protocol (left panel). (C) IPGTT was performed in HFD-fed obese mice at 18 weeks (right panel). Data represent the mean ± SEM.

