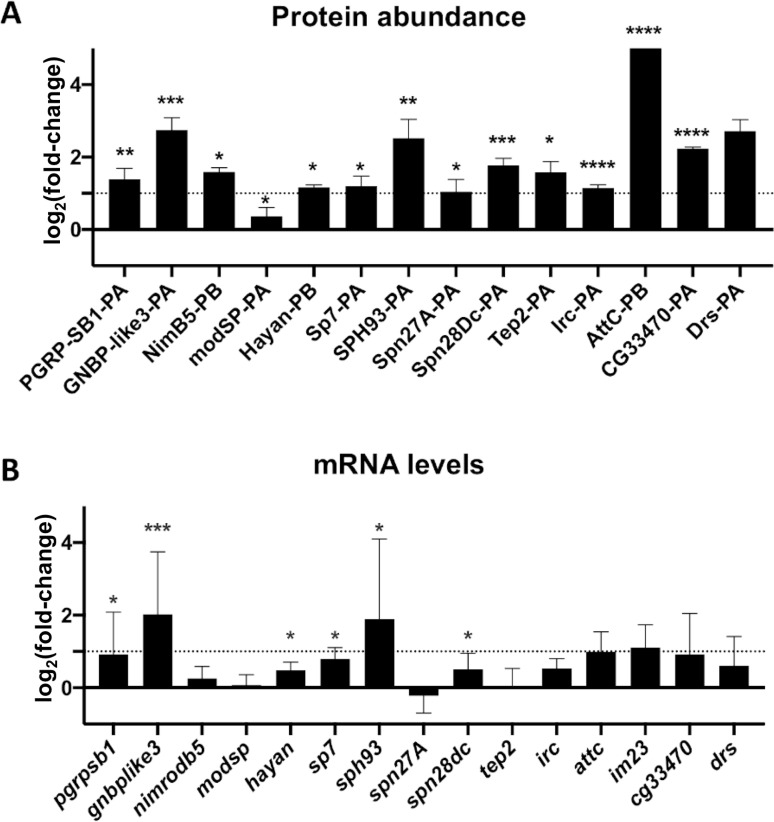
Fig 2. Spiroplasma infection induces a mild transcriptional immune response.
(A) Changes in a selection of immune-related protein group abundances quantified by LC-MS/MS. Data are expressed as fold change of the Label-Free Quantification (LFQ) values of Spiroplasma infected hemolymph over the uninfected control (log2 scale). *, p<0.05; ** p<0.005, ***; p<0.005, ****, p<0.0005 upon Student t-test. (B) mRNA quantification of a selection of candidate genes in uninfected and Spiroplasma-infected flies. Results are expressed as the fold change of target mRNA normalized by rpL32 mRNA in Spiroplasma-infected flies as compared to uninfected flies (log2 scale). *, p<0.05; ** p<0.005, ***; p<0.0005 upon Mann-Whitney test on ΔCt values. Each bar represents the mean +/- standard deviation of a pool of at least 2 independent experiments with 3 biological replicates each.

