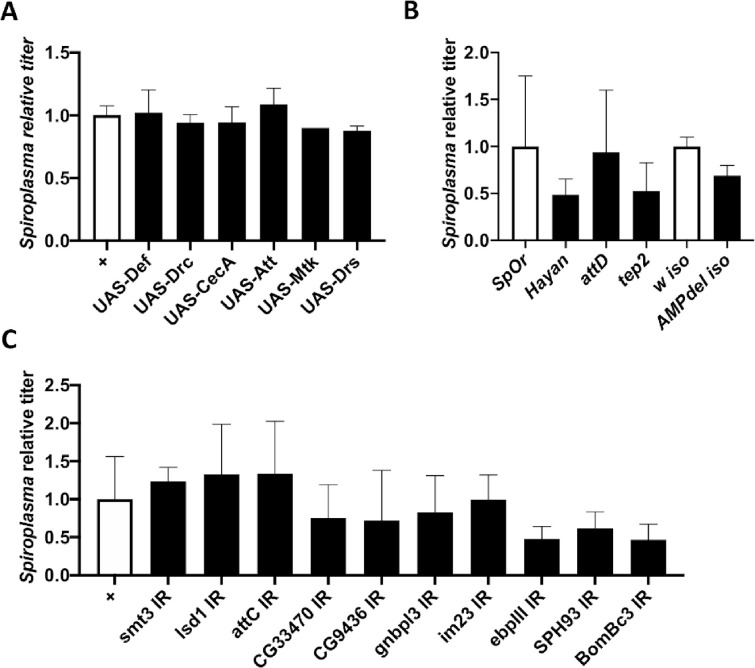
Fig 3. Targeted genetic screening of candidate proteins.
(A-C) Quantification of Spiroplasma titer in two weeks old flies in various genetic backgounds. Titer is expressed as the fold-change over the appropriate control line. All graphs represent the mean +/- standard deviation of a pool of at least 2 independent experiments with 3 biological replicates each. (A) Control flies (Act5C-GAL4 driver crossed w1118, white bars) are compared to flies overexpressing a single antimicrobial peptide gene driven by the ubiquitous Act5C-GAL4 driver (black bars). Titer is expressed as the fold-change over control. (B) Quantification of Spiroplasma titer in wild-type flies (OregonR, white bar) and hayan, attD and tep2 null mutants (black). Spiroplasma titer in AMP10 iso flies were compared to that of their isogenic wild-type counterpart (w1118 iso, white bar). (C) Quantification of the impact of RNAi-mediated knockdown on Spiroplasma titer with the Act5C-GAL4 driver. Titer is expressed as the fold-change over the control (Act5C-GAL4 driver crossed to w1118).

