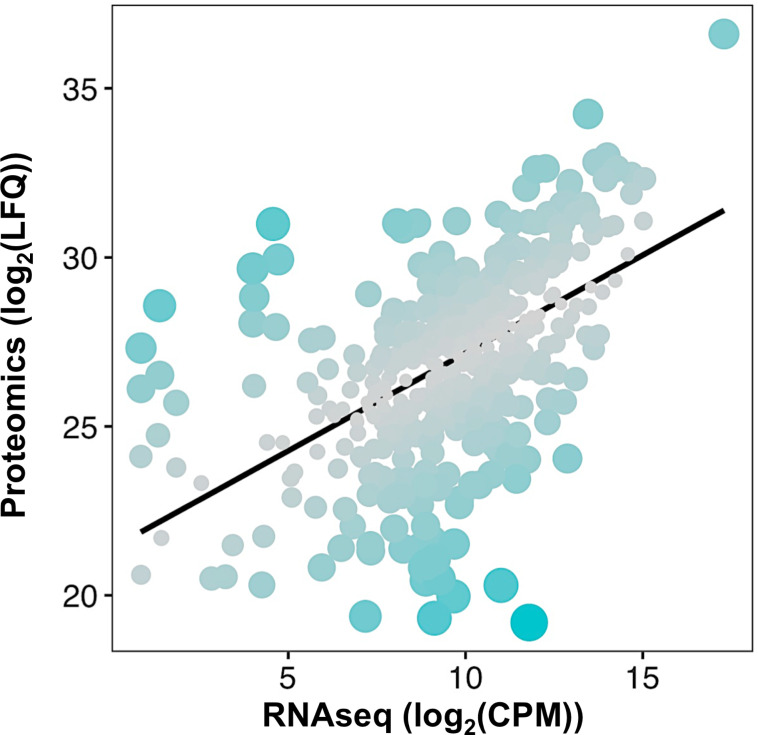
Fig 4. Spiroplasma transcription-translation correlation.
Each dot represents a protein positioned according to its log2(LFQ; Label-free Quantification) value in the proteome versus its log2(CPM; Count Per Million) in the transcriptomics dataset from [23]. The black line represents the linear model log2(LFQ) = 0.57892 x log2(CPM) + 21.38325, with an adjusted R2 = 0.2909. Dot size and color are adjusted to the residuals of the model, with bigger bluer dots indicating a higher residual hence a stronger deviation from the linear model for the considered protein.

