
Fig. 3.
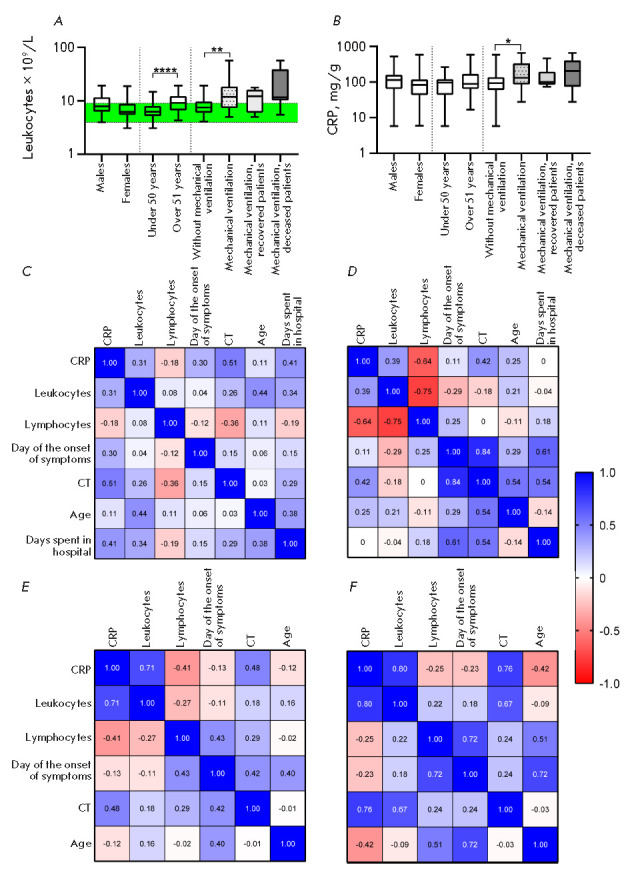
Distribution of the leukocyte count (A) and C-reactive protein level (B) within groups of patients of different ages, gender, and disease severity. The interval of normal values is marked in green. (C–F) – correlations for groups of patients who did not need mechanical ventilation (C), who needed mechanical ventilation (n = 16) (E), with subsequent recovery (n = 7) (D) or death (n = 9) (F)