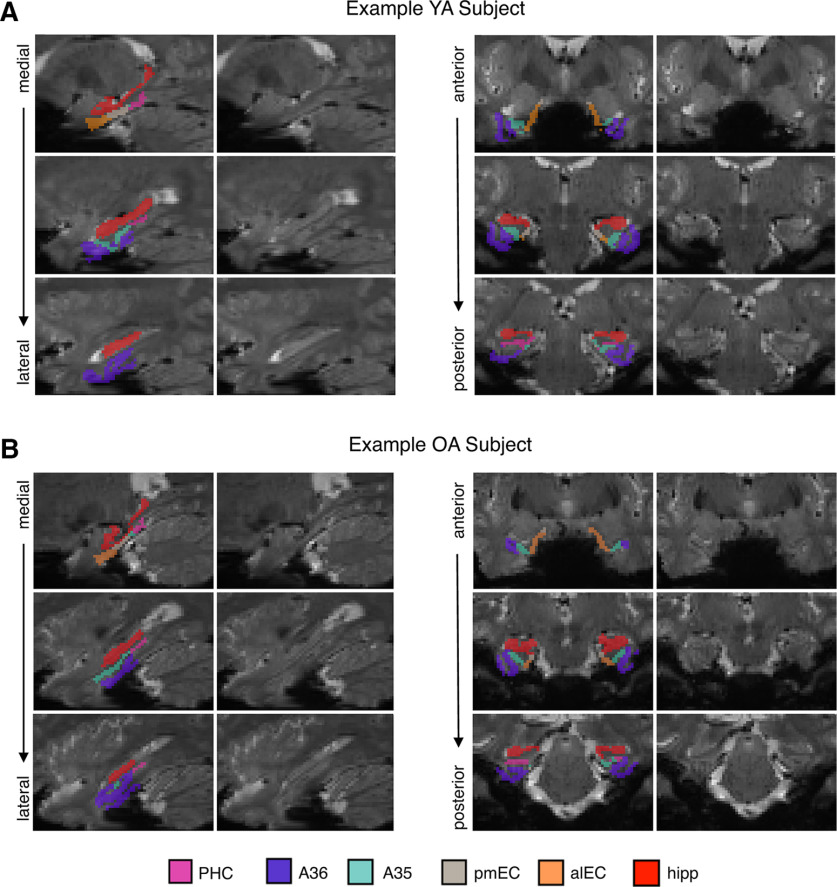
Figure 2.
Example MTL segmentations and fMRI signal intensity. Representative images from a YA subject (A) and OA subject (B) are shown to visually demonstrate the quality of fMRI signal in each ROI. For each example subject, the MTL segmentation is overlaid on the mean functional image on the left column, and the mean functional image is shown by itself on the right column. Slices are shown sagittally from medial to lateral (left) and coronally from anterior to posterior (right). ROIs: parahippocampal cortex (PHC), area 36 of perirhinal cortex (A36), area 35 of perirhinal cortex (A35), posteromedial EC (pmEC), anterolateral entorhinal cortex (alEC), hippocampus (hipp; all subfields merged). See Extended Data Figure 2-1 for corresponding proportions of voxels retained in each region in YA and OA groups after removing voxels of low signal.

