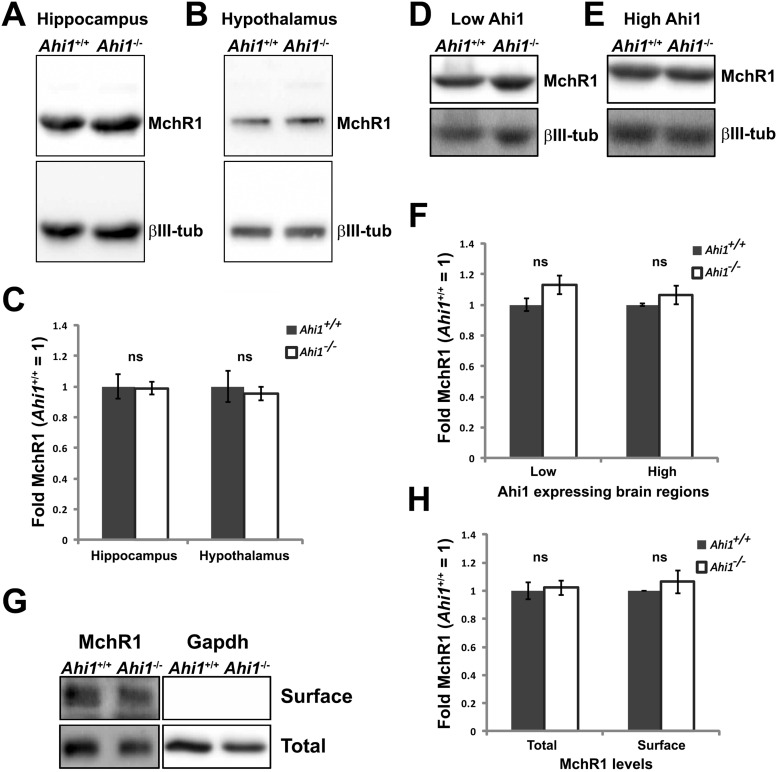
Figure 5.
Total and surface levels of MchR1 are intact in the absence of Ahi1. Western blot analysis of the MchR1 in primary neuronal cultures (A, B) and brain tissues (D, E) obtained from Ahi1+/+ and Ahi1–/– mice. Representative blots for total levels of MchR1 from hippocampal cultures (A), hypothalamic cultures (B), low Ahi1 expressing brain regions (cortex, hippocampus, striatum; D), and high Ahi1 expressing brain regions (midbrain and hindbrain; E). Quantification of total MchR1 levels in Ahi1+/+ and Ahi1–/– neuronal cultures (C) and brain lysates (F). MchR1 fold change was normalized to Ahi1+/+ values (=1; β-III tubulin levels), n ≥ 3 per tissue per genotype. Error bars represent SEM. Significance was determined by unpaired two-tailed t tests. G, Representative western blotting of MchR1 after cell-surface biotinylation assays and quantification of MchR1 surface levels normalized to Ahi1+/+ values (=1; H). Gapdh was used as an intracellular protein control as well as a loading control, n ≥ 3 per tissue/genotype. Error bars represent SEM. Significance was determined by unpaired two-tailed t tests; ns, not significant.

